Tag: Prometheus

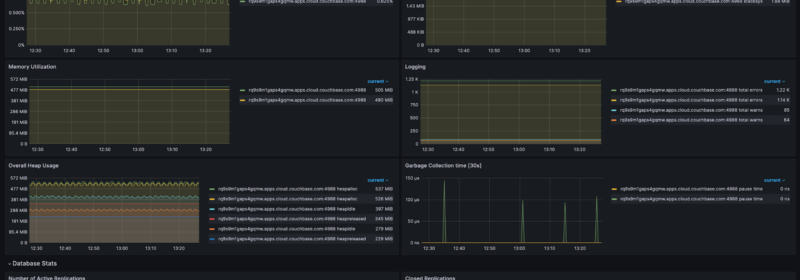
Scraping Database Metrics from Couchbase Capella with Prometheus
In this blog post, the first in a series, we’re going to show you how to set up a Prometheus server and connect it to your Couchbase Capella Database in order to collect metrics. What is Prometheus? Prometheus is a...

How to Monitor Capella App Services with Prometheus and Grafana
In this blog post, Couchbase explores how you can easily monitor Capella App Services using Prometheus metrics and Grafana to provide real-time insights.

Top Blogs of 2021 – Part 2
The final part in our two part blog series counting down the top 10 published blogs for this year.

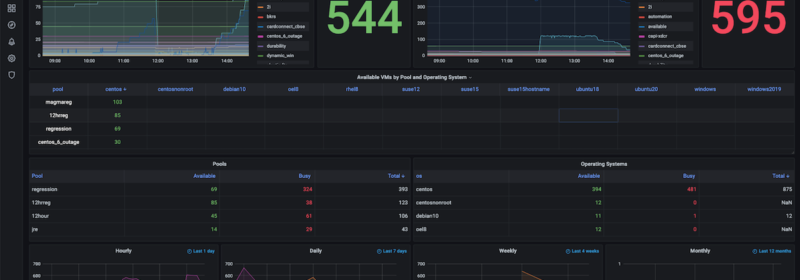
How to Build Observability Dashboards with Prometheus, Grafana & Couchbase
In this blog, we take you through the process you need to follow to build your own observability dashboard using Prometheus, Grafana and Couchbase.

Using Fluent Bit for Log Forwarding & Processing with Couchbase Server
Find out how to use Fluent Bit for log forwarding and processing with Couchbase Server, along with background on the various components involved.

Using Prometheus and Grafana With Couchbase Sync Gateway
Learn how to setup Couchbase Sync Gateway node monitoring and stat visualization using the Prometheus and Grafana platforms.

Advanced Sync with Couchbase 2.8 for Mobile and the Edge
The groundbreaking 2.8 release of Couchbase introduces enhancements to sync technology for disconnected and distributed cloud deployments.

Helm: Deploy & Monitor with Couchbase Autonomous Operator
Using helm to deploy Couchbase with Prometheus Monitoring in Kubernetes.

Monitoring a NoSQL Database with Couchbase and Prometheus
This blog post will walk through how to get Couchbase Server and Couchbase Autonomous Operator set up to work with Prometheus and Grafana using the Couchbase Prometheus Exporter, as well as giving a brief overview of how it all works.

Couchbase Autonomous Operator 2.0 with Prometheus – Part 2
A step by step guide for running the Couchbase Autonomous Operator with Prometheus on Amazon EKS and visualizing with Grafana

Couchbase Autonomous Operator 2.0 with Prometheus – Part 1
A step by step guide for running the Couchbase Autonomous Operator with Prometheus on Amazon EKS and visualizing with Grafana

Announcing Couchbase Autonomous Operator 2.0 Beta
Announcing Couchbase Autonomous Operator 2.0 Beta. Run Couchbase on Open Source Kubernetes & Red Hat Openshift. Learn about enhancements in 2.0 Beta.
Top Posts
- Optimizing Multi-Agent AI Systems With Couchbase
- Data Modeling Explained: Conceptual, Physical, Logical
- Data Analysis Methods: Qualitative vs. Quantitative Techniques
- What are Embedding Models? An Overview
- What are Vector Embeddings?
- What Is Data Analysis? Types, Methods, and Tools for Research
- Application Development Life Cycle (Phases and Management Models)
- A Breakdown of Graph RAG vs. Vector RAG
- High Availability Architecture: Requirements & Best Practice...