Tag: monitoring
-
Capella App Services: Real-time Log Streaming to Sumo Logic
In an earlier post, we discussed the fundamentals of Log Streaming on Capella App Services. App Services logs can be streamed in real-time to third-party observability platforms such as Datadog or collectors, hosted in…
-
What is Cloud Monitoring? Types, Best Practices, Tools
Cloud monitoring is the process of monitoring, analyzing, and troubleshooting cloud-based systems, applications, and infrastructure to ensure they’re running smoothly, efficiently, and securely. It involves collecting data and metrics from various sources, such as…
-
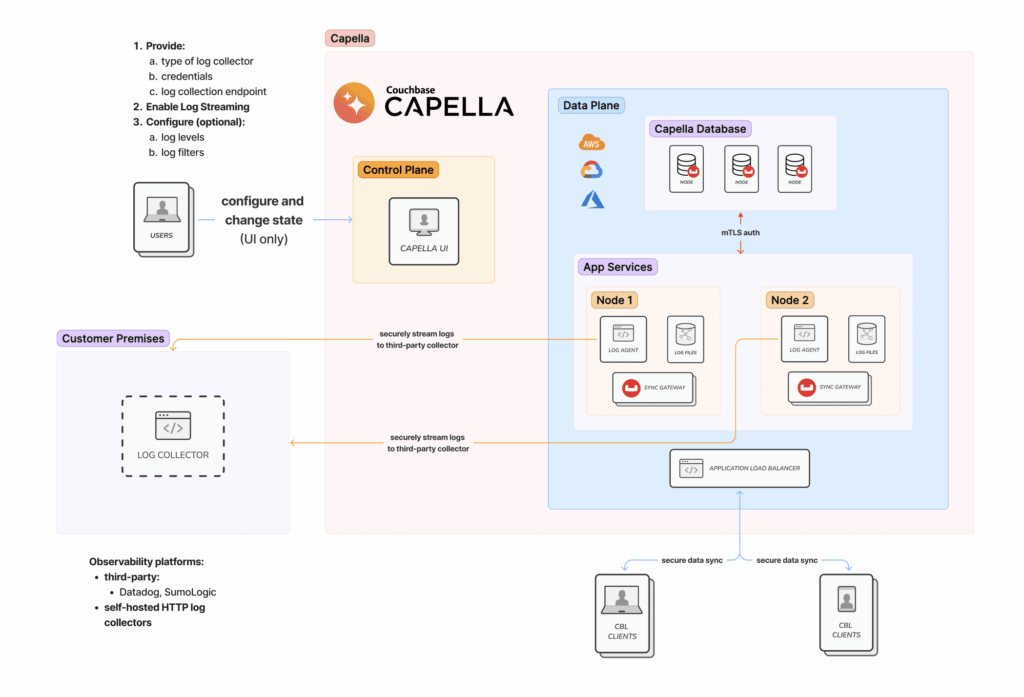
Capella App Services: Enhancing Observability with Real-Time Log Streaming Support
Capella App Services is a fully managed Backend-as-a-Service (BaaS), specifically tailored to mobile, IoT and edge applications. It empowers developers and organizations to seamlessly integrate with Couchbase Capella and synchronize data across various devices…
-
Scraping Database Metrics from Couchbase Capella with Prometheus
In this blog post, the first in a series, we’re going to show you how to set up a Prometheus server and connect it to your Couchbase Capella Database in order to collect metrics.…
-
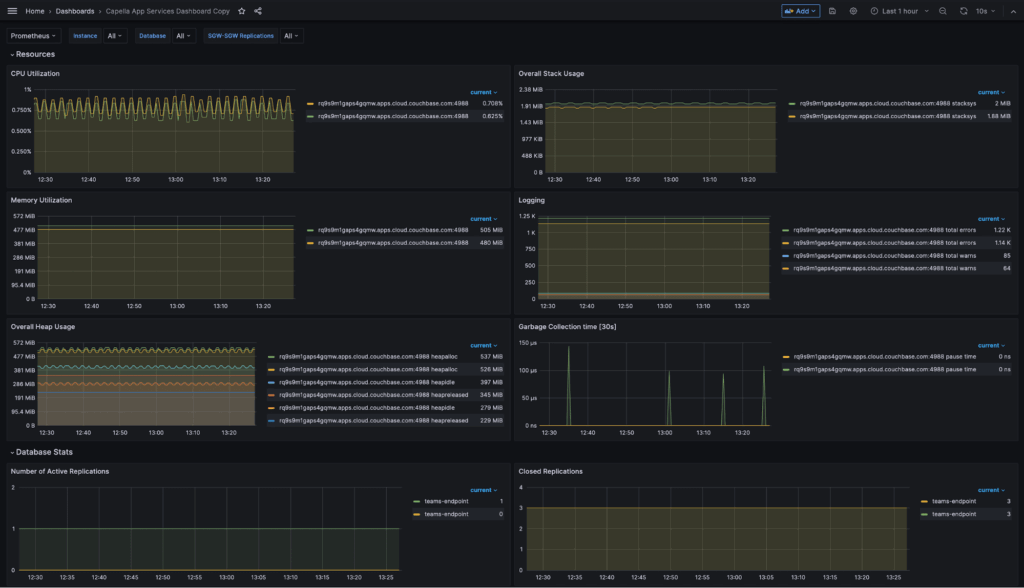
How to Monitor Capella App Services with Prometheus and Grafana
Capella App Services is a fully managed backend as a service (BaaS), that is specifically tailored to mobile, IoT and edge applications. It empowers developers and organizations to seamlessly integrate with Couchbase Capella and…