Tag: data visualization
What Is Data Analysis? Types, Methods, and Tools for Research
Data analysis involves cleaning & understanding data to create actional insights. Find a breakdown of types, methods, & tools in this overview from Couchbase!
Couchbase Server 7.0.2 according to the rule of 3’s
Couchbase Server 7.0.2 introduces security enforcement capabilities and new data visualizations within the Query and Analytics Workbench.
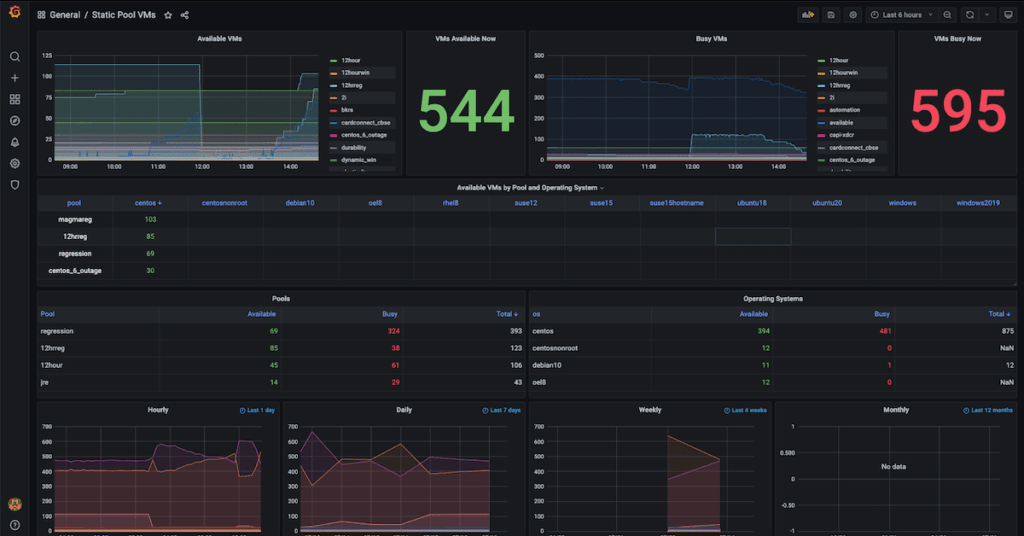
How to Build Observability Dashboards with Prometheus, Grafana & Couchbase
In this blog, we take you through the process you need to follow to build your own observability dashboard using Prometheus, Grafana and Couchbase.
Data Visualization with Couchbase and Knowi
Data visualization and reporting can help decision makers to identify patterns and concepts in analytics. The Cincinnati Reds are using Couchbase and Knowi to visualize ballpark attendance.
Top Posts
- Data Modeling Explained: Conceptual, Physical, Logical
- What are Embedding Models? An Overview
- Data Analysis Methods: Qualitative vs. Quantitative Techniques
- Application Development Life Cycle (Phases and Management Models)
- What Is Data Analysis? Types, Methods, and Tools for Research
- What are Vector Embeddings?
- A Benchmark for Evaluating NL2SQL++ Systems
- The Importance of Data Preprocessing in Machine Learning (ML)
- Vector Database Use Cases: Search, RAG, and AI Apps