
With the recent release of Couchbase Autonomous Operator (CAO) 2.2, we have recently provided log processing and forwarding for the Kubernetes deployments using the OSS Fluent Bit tooling. This is also OSS and available on GitHub or as a container.
Fluent Bit started as a native log forwarding solution for embedded targets so you can reuse our Kubernetes solution for on-premise deployments or even those using Kubernetes without the CAO as well.
This blog post will walk you through how to do that along with a bit of background on the various components involved. If you just want the details jump to the Log Forwarding section. A fully working example is also available in this GitHub repository.
What Is Fluent Bit?
Fluent Bit is a widely used and highly performant OSS solution for dealing with processing and transporting your logs. If you do not have a centralised log solution already, then this post will demonstrate how you can easily provide it. A particular example is for audit log forwarding to any of the supported targets provided by Fluent Bit (e.g., S3).
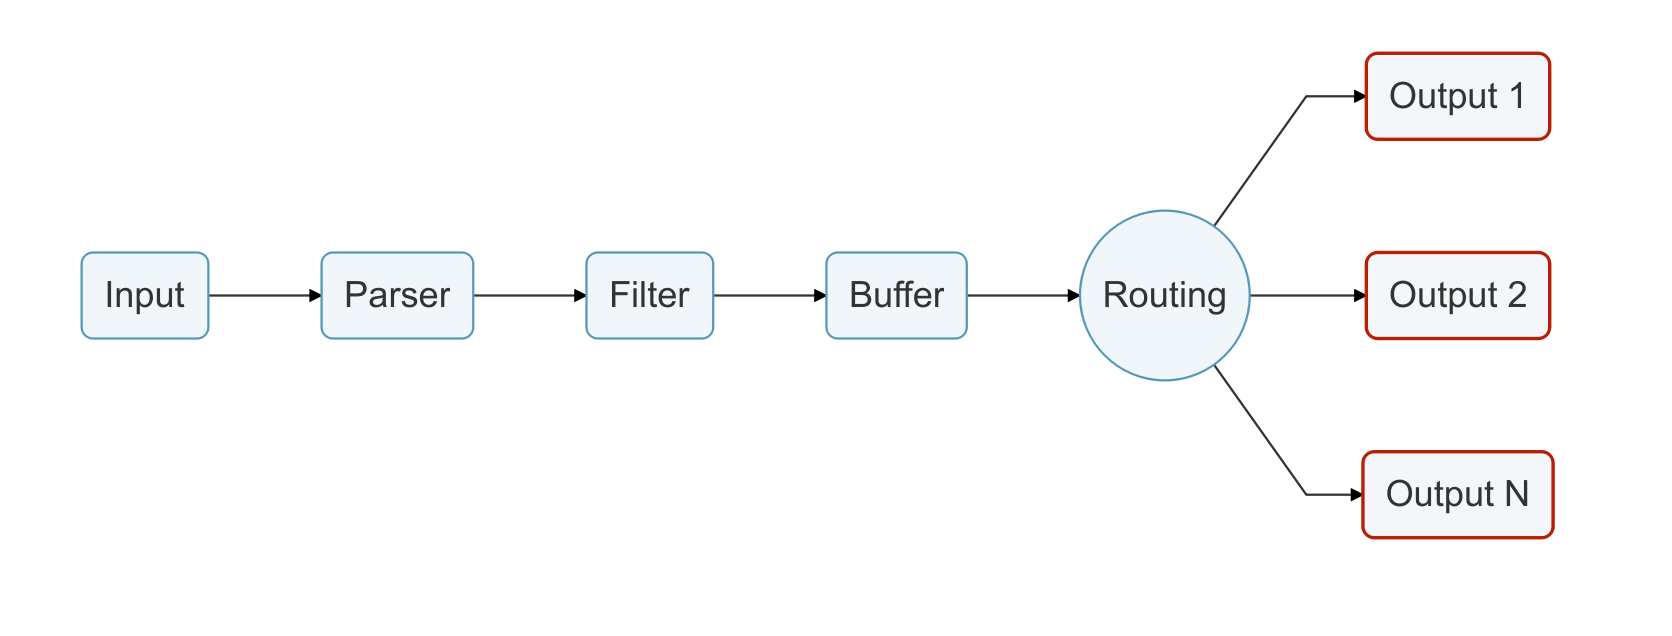
Fluent Bit is essentially a configurable pipeline that can consume multiple input types, parse, filter or transform them and then send to multiple output destinations including things like S3, Splunk, Loki and Elasticsearch with minimal effort. There is a lot of documentation available that goes into the detail of how it all works.
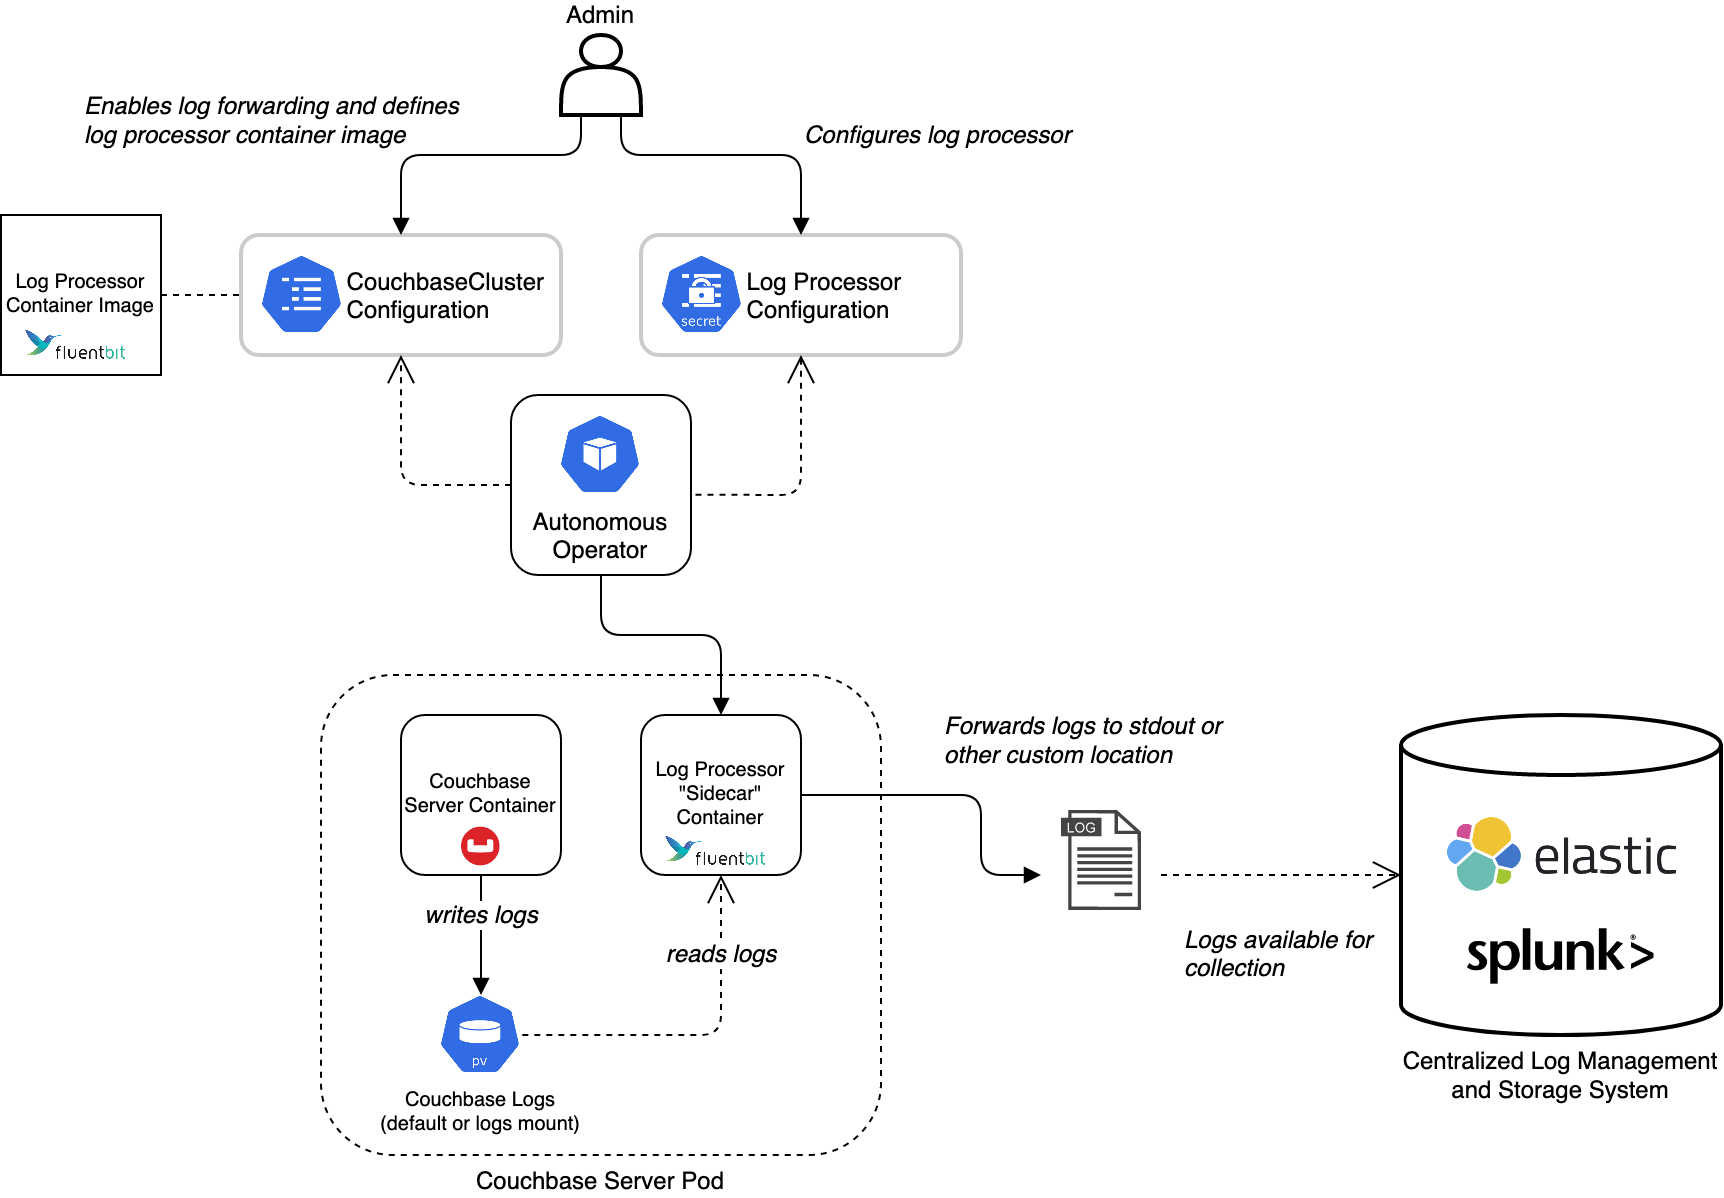
It is widely used within Kubernetes deployments (e.g., GKE and AWS deploy it by default) as a daemonset which just means an application (the daemon) you run on all the Kubernetes nodes that make up the cluster. Fluent Bit usually then tails the various container logs (container best practice is to log to stdout and the container runtime pushes this to a rotated file locally) and supports forwarding them from the local node to some centralised log management tooling. Rather than having to deploy new binaries, it is all managed by configuration changes only.
Fluent Bit turns logs into structured data in a common internal format (MessagePack, a binary optimised JSON format) to support having various plugins then work on it (e.g., to filter or transform something with a generic plugin you need it to be in a common format) or send it to a particular output in the appropriate format for that endpoint. To do this, Fluent Bit uses parsers. However, it does support just reading the whole line in a file as a single key-value pair to simplify conversion and as a fall back if parsing fails.
Couchbase Logging Solution with Fluent Bit
We have taken the OSS Fluent Bit solution and extended it to satisfy some specific Couchbase needs, such as:
- Support dynamic configuration change without restarting Couchbase Server and triggering a rebalance. This is an important one for the CAO use case but likely less so on-premise.
- In-flight redaction support and pre-processing of rebalance reports.
- Processing the various log files with a common approach.
Of these, the most important one for on-premise deployments is to handle the various log files.
The log files produced by Couchbase Server are in various distinctive formats and some of the log statements cover multiple lines so relying on line-by-line sending is not ideal. Most tooling can handle it (e.g., PromTail can parse multi-line statements as well) but it would require specific configuration whereas our solution already solves all this.
A basic set of parsers has been produced to handle the various logs and this has also been contributed back to the OSS Fluent Bit project: From release 1.7.6+, the parsers are available in the official image and binary installation. This means that everything presented here is completely OSS and can be used without any Couchbase-specific deployment.
Using Grafana, Prometheus and Loki
Grafana is an open source observability platform that can handle various data sources to show you what your platform is doing in real time as well as triggering alerts when certain conditions are met. The same stack might include Prometheus for metric monitoring and Loki for log storage and querying.
For this blog post, I am using these technologies as a placeholder for an equivalent centralised observability platform that Fluent Bit can target. It is simple to run up locally as a test stack for demonstration purposes here. Separately, Couchbase already provides a Prometheus metric monitoring option which could also be integrated here in the same fashion.
Alternatives to this stack could be Splunk, Elasticsearch with Kibana or managed solutions such as Amazon Cloudwatch or Azure Log Analytics.
How to Run All These Tools On-Premise
This section will provide tutorial-style details on running a log forwarding solution using Fluent Bit on an on-premises deployment.
Please note that running a log forwarding solution with Fluent Bit for Couchbase Server in an on-premises deployment is not officially supported.
The recommendation is to use the Couchbase Fluent Bit container (or the official Fluent Bit one). However, Fluent Bit can also be installed directly and the configuration provided by the Couchbase Fluent Bit image can be reused to achieve most, but not all, of the same effects.
Every supported platform for Couchbase Server 6.6.2+ can run containers. See the documentation for installing the container runtime here. Be sure to enable support for Linux containers on a Windows platform.
For the purposes of this blog post, I will be using the containerised versions of Couchbase Server just to run a local cluster and showing how to then connect the Couchbase Fluent Bit container to their logs. A native server binary can also be used directly.
The Couchbase Server container is purely run as an example to generate the logs. If you have a running server already then just use the directory it has for its logs in the Log Forwarding section. Similarly if you want to use the native binary for Couchbase Server then you can.
Step 1: Couchbase Server Deployment
Ignore this section if you have a deployed instance already. If it is a containerised version just make sure the log directory is exposed via a volume or bind mount on the host (as we do in the tutorial below).
Follow the guidance to deploy a set of one of more containers as a Couchbase cluster but with a volume for the logs:
|
1 2 3 |
mkdir –p /tmp/couchbase–logs docker run —rm –d —name db –p 8091–8096:8091–8096 –p 11210–11211:11210–11211 –v /tmp/couchbase–logs/:/opt/couchbase/var/lib/couchbase/logs/ couchbase:6.6.2 |
The main thing here is to make sure we expose the logs produced by Couchbase Server so another container can pick them up, otherwise they would all be isolated inside the container. For a native binary deployment of Couchbase Server, it would just be writing to a directory on the host so this is not required.
The Couchbase Server documentation details the location of the log directory.
Note that this uses a named container called db so make sure one does not already exist otherwise it will generate an error due to the conflict with docker rm db. Our command above automatically cleans up the container on exit.
Now, we can check logs are being created in our directory:
ls -l /tmp/couchbase-logs
total 1344
-rw-r-----  1 patrickstephens  wheel   23330  4 Jun 11:11 babysitter.log
-rw-r-----  1 patrickstephens  wheel     152  4 Jun 11:11 couchdb.log
-rw-r-----  1 patrickstephens  wheel  330926  4 Jun 11:11 debug.log
-rw-r-----  1 patrickstephens  wheel       0  4 Jun 11:11 error.log
-rw-r-----  1 patrickstephens  wheel    6926  4 Jun 11:11 goxdcr.log
-rw-r-----  1 patrickstephens  wheel       0  4 Jun 11:11 http_access.log
-rw-r-----  1 patrickstephens  wheel    2073  4 Jun 11:11 http_access_internal.log
-rw-r-----  1 patrickstephens  wheel   73345  4 Jun 11:11 info.log
-rw-r-----  1 patrickstephens  wheel    1928  4 Jun 11:11 json_rpc.log
-rw-r-----  1 patrickstephens  wheel       0  4 Jun 11:11 mapreduce_errors.log
-rw-r-----  1 patrickstephens  wheel    5303  4 Jun 11:11 memcached.log.000000.txt
-rw-r-----  1 patrickstephens  wheel    1389  4 Jun 11:11 metakv.log
-rw-r-----  1 patrickstephens  wheel   67103  4 Jun 11:11 ns_couchdb.log
drwxr-x---  2 patrickstephens  wheel      64  4 Jun 11:11 rebalance
-rw-r-----  1 patrickstephens  wheel  144264  4 Jun 11:11 reports.log
-rw-r-----  1 patrickstephens  wheel    4803  4 Jun 11:11 stats.log
-rw-r-----  1 patrickstephens  wheel       0  4 Jun 11:11 views.log
-rw-r-----  1 patrickstephens  wheel       0  4 Jun 11:11 xdcr_target.log
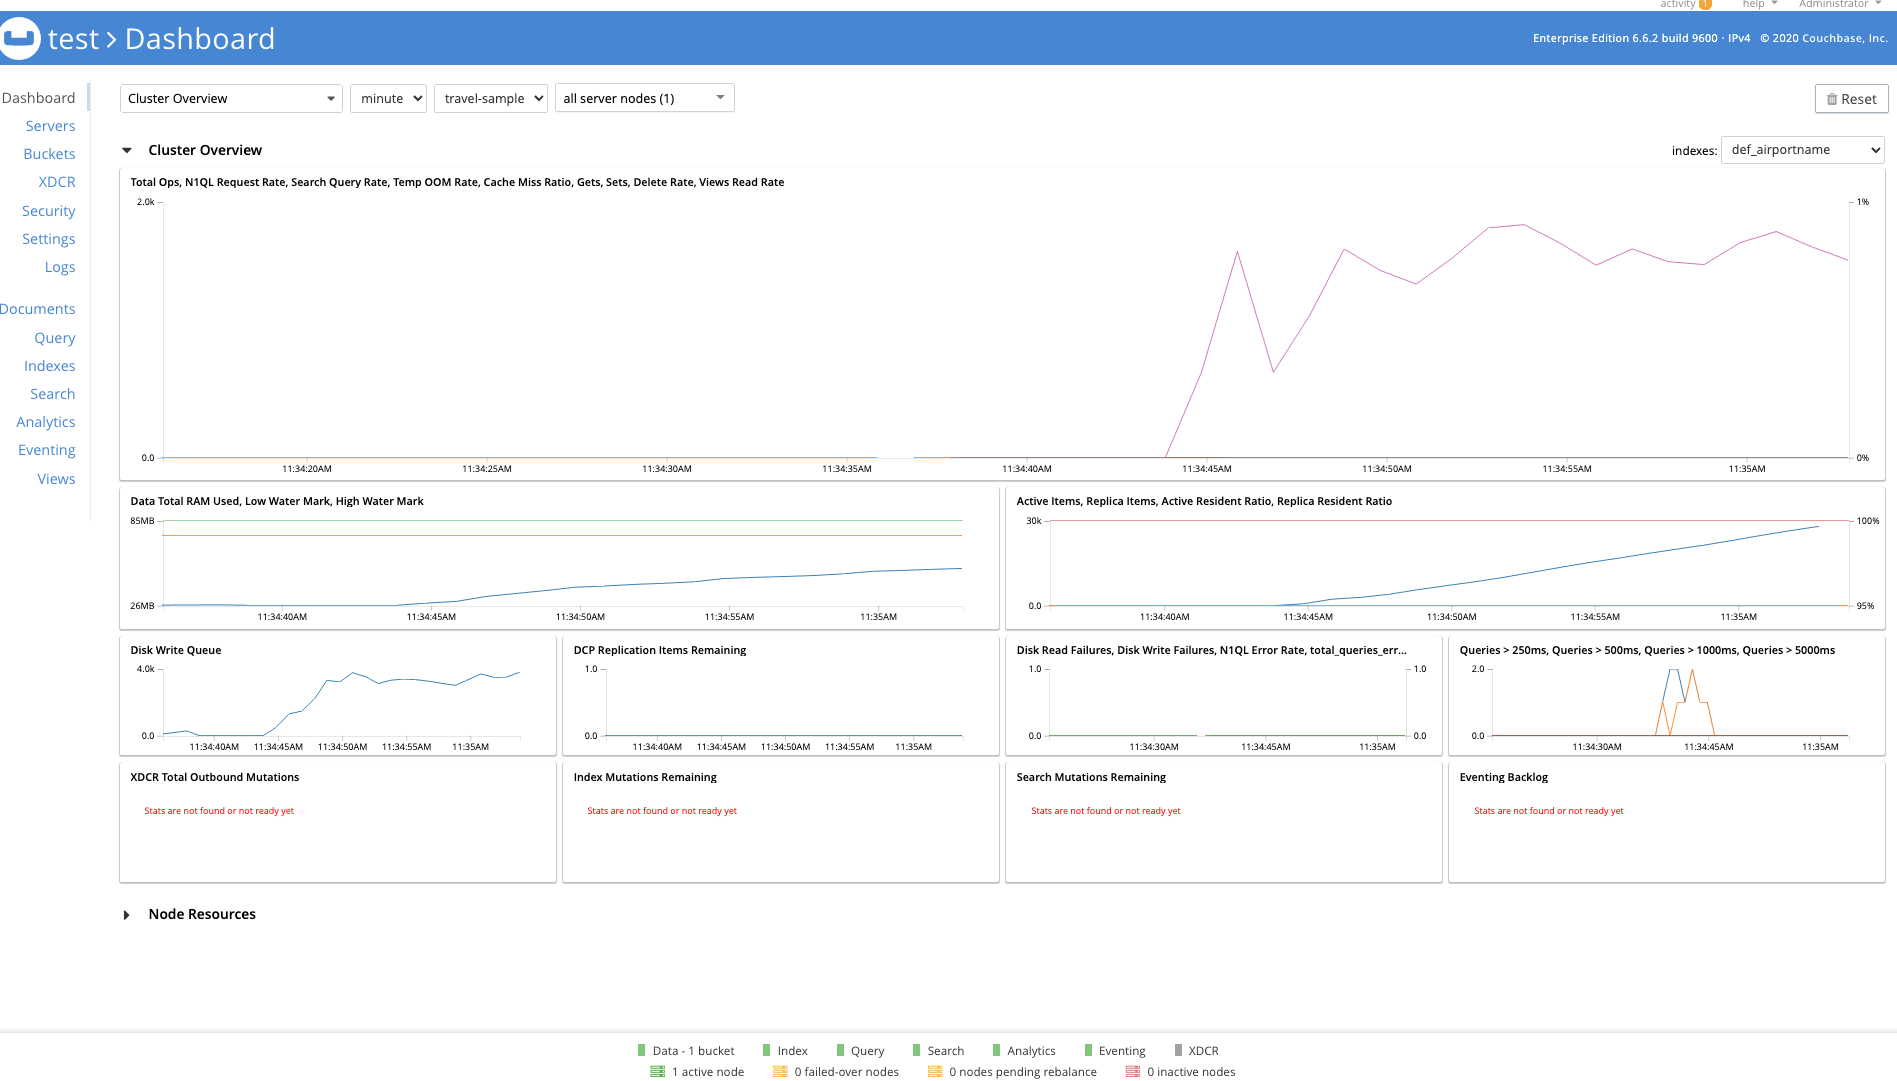
For the purposes of this deployment we do not really need to actually configure the cluster but it is useful to do so in order to get proper logs and data in there. Follow the instructions in the official documentation to configure the cluster via the UI and import some sample data as well if you want to.
If you want to run multiple containers on the same node to simulate a multi-node Couchbase Server cluster then make sure to use a separate log directory (or volume) for each container. Then run a Couchbase Fluent Bit image per Couchbase Server container mounting each directory as per the next section on Log Forwarding.
Step 2: Log Forwarding
The meat of the blog post is in this section: How do I configure Couchbase Server logs to be processed and forwarded by Couchbase Fluent Bit?
Once we have configured the cluster and optionally added some buckets, sample data, etc. we can run the Fluent Bit container. This is fairly simple when using the Couchbase Fluent Bit image:
docker run --rm -d --name logger -v /tmp/couchbase-logs/:/opt/couchbase/var/lib/couchbase/logs/:ro
-e COUCHBASE_LOGS=/opt/couchbase/var/lib/couchbase/logs/ couchbase/fluent-bit:1.0.1
As you can see here we mount our local directory and specify it as an environment variable (so you can mount it into another location in the container and just point it at that). This is how you use it with a natively deployed Couchbase Server: Mount the local directory for logs into the container instead of the temporary directory used in this example.
Refer to the official documentation for the specific details of where Couchbase Server stores its logs. This base directory is the one that would need mounting into the Couchbase Fluent Bit image as above. Be aware of permissions issues as well.
The Couchbase Fluent Bit repository documentation specifies the various configuration options and their default values. Note that the default location for logs to be processed in the Couchbase Fluent Bit 1.0.1 version of the image is slightly different from that used by Couchbase Server 6.6.2, so we override it above to use the same location on both. (Later versions of the Couchbase Fluent Bit image align with the Couchbase Server location but introduce other features out of scope for this post.)
The container should now be running and processing logs from the directory we have locally to then send to its standard output stream by default. With Fluent Bit, we can see this by a call to docker logs logger which should show logs being output as they update:
[0] couchbase.log.xdcr: [1622801916.603000000, {"filename"=>"/opt/couchbase/var/lib/couchbase/logs//goxdcr.log", "timestamp"=>"2021-06-04T10:18:36.603Z", "level"=>"INFO", "message"=>" GOXDCR.ResourceMgr: Resource Manager State = overallTP: 0 highTP: 0 highExist: false lowExist: false backlogExist: false maxTP: 0 highTPNeeded: 0 highTokens: 0 maxTokens: 0 lowTPLimit: 0 calibration: None dcpAction: Reset processCpu: 1 idleCpu: 95", "pod"=>"c901775dec2b", "logshipper"=>"couchbase.sidecar.fluentbit"}]
[0] couchbase.log.debug: [1622801986.855000000, {"filename"=>"/opt/couchbase/var/lib/couchbase/logs//debug.log", "logger"=>"ns_server", "level"=>"debug", "timestamp"=>"2021-06-04T10:19:46.855Z", "message"=>"ns_1@cb.local:compaction_daemon<0.532.0>:compaction_daemon:process_scheduler_message:1306]No buckets to compact for compact_views. Rescheduling compaction.", "pod"=>"c901775dec2b", "logshipper"=>"couchbase.sidecar.fluentbit"}]
[0] couchbase.log.http_access_internal: [1622801986.000000000, {"filename"=>"/opt/couchbase/var/lib/couchbase/logs//http_access_internal.log", "host"=>"127.0.0.1", "user"=>"@goxdcr-cbauth", "timestamp"=>"04/Jun/2021:10:19:46 +0000", "method"=>"GET", "path"=>"/pools/nodes", "code"=>"404", "size"=>"14", "client"=>"couchbase-goxdcr/6.6.2", "pod"=>"c901775dec2b", "logshipper"=>"couchbase.sidecar.fluentbit"}]
This is just an example of the output you may have.
Note that each log file has its own stream using a Fluent Bit tag in the format: couchbase.log.<name>. This allows you to perform different processing or routing of individual logs. For example, audit logs may need to go to a specific endpoint different from the rest or you may want to filter out lines from a particular log. You can even match multiple entries or the same entry to different outputs.
Running the container can be done as part of a startup script with systemd or similar as Couchbase Server would be. The container runtime can also automatically start specified containers every time.
Step 3: Visualising Logs Live in Grafana
The default configuration provided by the container is to send all the logs to a standard output. However you can provide your own configuration file to use to do different things with no other change. Being able to modify log processing and forwarding is just a simple configuration change, which is one of the key benefits of Fluent Bit.
To highlight this, we are going to run up a local version of the Loki stack, which is Grafana plus Loki for log capture (and Prometheus for metric capture). We will then configure our container to send logs to Loki so we can visualize them in Grafana graphically. The Loki and Grafana documentation has alternative ways to deploy the Loki stack, so refer to that documentation linked above for full details.
A full working example from the below section is provided in the Couchbase Fluent Bit repo on GitHub using Docker Compose to run up the containers all configured correctly.
Make sure to stop our previously configured log forwarding container. You could also run up another; just make sure to give it a different name, like docker stop logger.
Now, run up Loki and Grafana, making sure to expose the ports required for each (3100 and 3000 respectively):
|
1 2 |
docker run —rm –d —name loki –p 3100:3100 grafana/loki:2.0.0 –config.file=/etc/loki/local–config.yaml docker run —rm –d —name grafana –p 3000:3000 –e GF_SECURITY_ADMIN_PASSWORD=password grafana/grafana:7.5.2 |
You can check both have started correctly with a call to docker ps and see Fluent Bit logs with a call to docker logs <name>.
To support forwarding to Loki, we are going to get the IP address of the local container that is running it. Normally you would deploy it to a resolvable host or service name, but for the demo we are running everything as local containers.
If you run docker inspect loki it will output a load of information about the container, with a section for networking:
            "Networks": {
                "bridge": {
                    "IPAMConfig": null,
                    "Links": null,
                    "Aliases": null,
                    "NetworkID": "eb681161db08003e6401b745b0a51c1e1183bee13462fae74ea68ab9736baf34",
                    "EndpointID": "28df33de36007bff0a00c14aa4617d235dadd882e5109feaf536fd1b9b980afd",
                    "Gateway": "172.17.0.1",
                    "IPAddress": "172.17.0.4",
                    "IPPrefixLen": 16,
                    "IPv6Gateway": "",
                    "GlobalIPv6Address": "",
                    "GlobalIPv6PrefixLen": 0,
                    "MacAddress": "02:42:ac:11:00:04",
                    "DriverOpts": null
                }
            }
To get just the IP address we can format the query as per the official documentation:
docker inspect --format='{{range .NetworkSettings.Networks}}{{.IPAddress}}{{end}}' loki
172.17.0.4
For my deployment, the IP address is 172.17.0.4, but yours may differ so substitute it later.
The example provided in the repository automatically provisions Grafana as well to use Loki, but we need to do this manually here. If you connect to https://localhost:3000/login then you can log into Grafana as the admin user with the password in the environment variable above in the Grafana container run command.
We now need to add Loki as a datasource at: https://localhost:3000/datasources
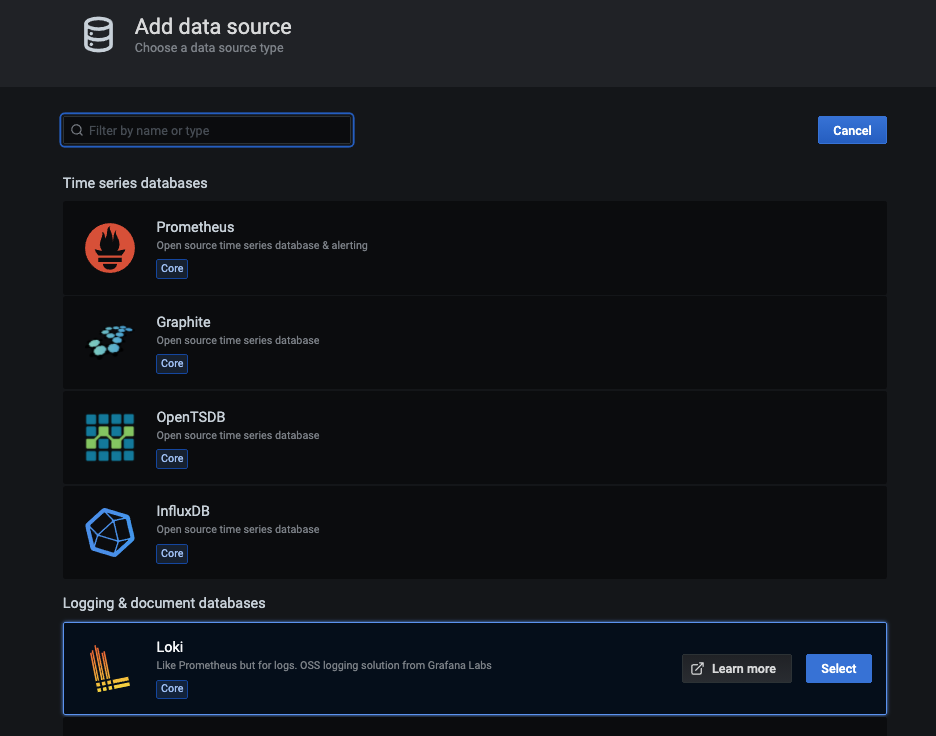
Set up the data source using the IP address of the Loki container and port 3100 as forwarded when we first ran the container:
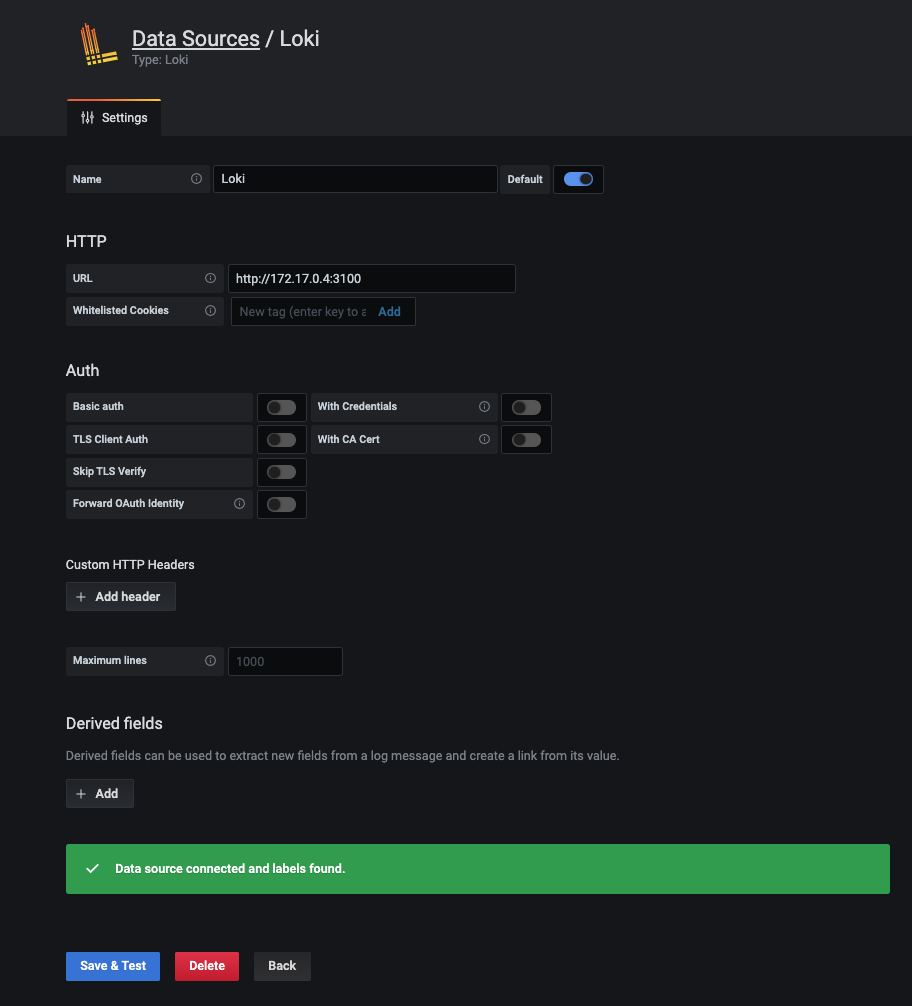
Step 4: Custom Configuration
Now that we have Loki and Grafana configured correctly, let’s create a new configuration for our log forwarder to send the logs to it.
As part of our Couchbase Fluent Bit deployment, we have broken up various sections of the configuration into reusable files to include so we could just use a two-line file for this, such as this one below:
@include /fluent-bit/etc/fluent-bit.conf
@include /fluent-bit/etc/couchbase/out-loki.conf
This file now includes our existing default configuration plus an output for Loki that is not used by default but is included:
[OUTPUT]
    name   loki
    match  *
    host loki
    labels job=couchbase-fluentbit
    label_keys $filename,$level
As you can see, this output matches all the inputs and sends them to a host called loki. For this demonstration, we are going to use the specific IP address of the container running Loki in the configuration file:
cat < /tmp/fluent-bit.conf >> __EOF__
@include /fluent-bit/etc/fluent-bit.conf

[OUTPUT]
    name   loki
    match  *
    host 172.17.0.4
    labels job=couchbase-fluentbit
    label_keys $filename,$level

__EOF__
Now we can run up the log forwarding again but using this custom configuration. Make sure you either rename it or stop the previous one:
|
1 |
docker run —rm –d —name logger –v /tmp/couchbase–logs/:/opt/couchbase/var/lib/couchbase/logs/:ro –e COUCHBASE_LOGS=/opt/couchbase/var/lib/couchbase/logs/ –v /tmp/fluent–bit.conf:/fluent–bit/config/fluent–bit.conf:ro couchbase/fluent–bit:1.0.1 |
Notice we also run everything as a read-only mounted filesystem so we cannot modify anything in the container – the raw logs are not touched.
Step 5: Viewing Our Logs Live
Now logs should start being sent to Loki and Grafana. You can then view them at: https://localhost:3000/explore?orgId=1&left=%5B%22now-1h%22,%22now%22,%22Loki%22,%7B%22expr%22:%22%7Bjob%3D%5C%22couchbase-fluentbit%5C%22%7D%22%7D%5D
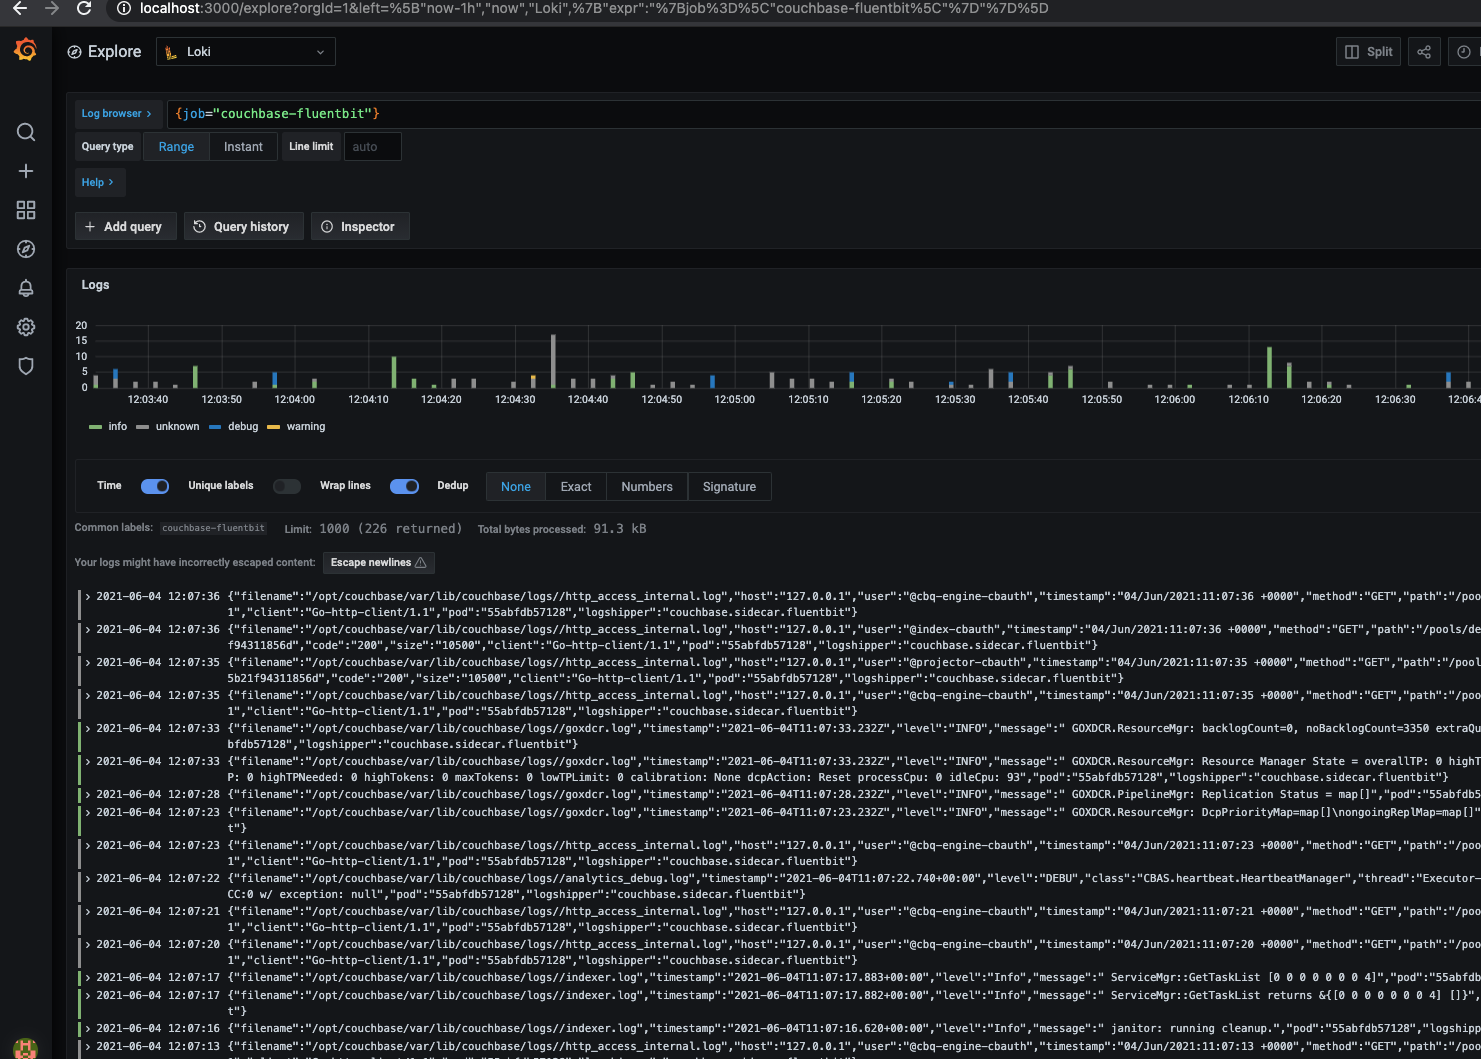
You can now create dashboards and view the logs directly live in Grafana.
Known Issues
Entry out of order
You may see errors in the Fluent Bit log like this when sending to Loki:
[2021/06/04 11:03:50] [error] [output:loki:loki.1] 172.17.0.4:3100, HTTP status=400
entry with timestamp 2021-06-04 11:03:43.507 +0000 UTC ignored, reason: 'entry out of order' for stream: {job="couchbase-fluentbit"}
This is a known issue with Loki. It relies on receiving every stream in order but when trying to multiplex multiple streams, and with network jitter, sometimes this is not possible. It is usually better to pick specific streams to send with separate Loki output plugins and apply worker threads for each plugin. As this blog post only uses Loki to demonstrate log output, this issue is not covered here.
New Versions of Couchbase Fluent Bit
This blog post covers version 1.0.1 of the Couchbase Fluent Bit image which is the officially supported version with CAO 2.2. Couchbase Autonomous Operator can use any version as a sidecar, including completely different images, but these would not be supported for any issues that come up.
Versions 1.0.2 & 1.0.3 of the image include some additional Kubernetes integration and improvements, particularly when integrating with Loki. Refer to the release notes for full details.
Unfortunately some of these changes mean additional environment variables must be specified when running the container (done automatically as part of the CAO). Without these it will fail to run, indicating they are missing. They can be specified on the command line using the -e key=value syntax shown previously. This will be resolved in the next release of the Couchbase Fluent Bit image under change K8S-2171.
Conclusion
Hopefully this gives you a nice taster for how you can use log forwarding with Couchbase Server and Fluent Bit.
There are already Prometheus monitoring options available for Couchbase Server using the Couchbase Prometheus Exporter which can be integrated with this same Grafana stack into a single observability pane of glass. The Couchbase SDKs provide tracing support with Jaeger which could also be integrated into Grafana. These topics are the subject of existing and further blog posts so keep your eyes peeled.
Leave a comment
You must be logged in to post a comment.