Couchbase Server currently has a plethora of stats from data access throughput in KV and query to system resources like disk IO and CPU to newer services like eventing. There have been a number of community authored Prometheus Exporters written for Couchbase as well as the exporter for monitoring Sync Gateway and we are building on that momentum adding it first to Kubernetes and OpenShift officially.
With the release of Autonomous Operator 2.0, we support Prometheus stats in conjunction with the Operator managed deployments. While not yet officially supported, there are also alternative runtime configurations to achieve the same goals. More on that toward the end.
This blog post will walk through how to get the exporter set up along with Prometheus and Grafana, as well as giving a brief overview of how to monitor a NoSQL database.
Background
Couchbase Server already exposes metrics in a JSON format through a rest interface – so the exporter’s job is to take those metrics and output them in a Prometheus-friendly format.
It turns REST endpoint statistics from Couchbase Server like these, found in bucket info –
|
1 2 3 4 5 6 7 8 9 10 11 |
basicStats: { quotaPercentUsed: 24.55603790283203, opsPerSec: 0, diskFetches: 0, itemCount: 7303, diskUsed: 28024334, dataUsed: 19720703, memUsed: 25748872, vbActiveNumNonResident: 0 }, |
Into a format like this
|
1 2 3 4 5 6 7 8 9 10 11 12 13 14 15 16 |
# HELP CBBucketInfo_basic_dataused_bytes basic_dataused # TYPE CBBucketInfo_basic_dataused_bytes gauge CBBucketInfo_basic_dataused_bytes{bucket="beer-sample"} 1.9720703e+07 CBBucketInfo_basic_dataused_bytes{bucket="tester"} 8.435712e+06 # HELP CBBucketInfo_basic_diskfetches basic_diskfetches # TYPE CBBucketInfo_basic_diskfetches gauge CBBucketInfo_basic_diskfetches{bucket="beer-sample"} 0 CBBucketInfo_basic_diskfetches{bucket="tester"} 0 # HELP CBBucketInfo_basic_diskused_bytes basic_diskused # TYPE CBBucketInfo_basic_diskused_bytes gauge CBBucketInfo_basic_diskused_bytes{bucket="beer-sample"} 2.8024334e+07 CBBucketInfo_basic_diskused_bytes{bucket="tester"} 8.463402e+06 # HELP CBBucketInfo_basic_itemcount basic_itemcount # TYPE CBBucketInfo_basic_itemcount gauge CBBucketInfo_basic_itemcount{bucket="beer-sample"} 7303 CBBucketInfo_basic_itemcount{bucket="tester"} 0 |
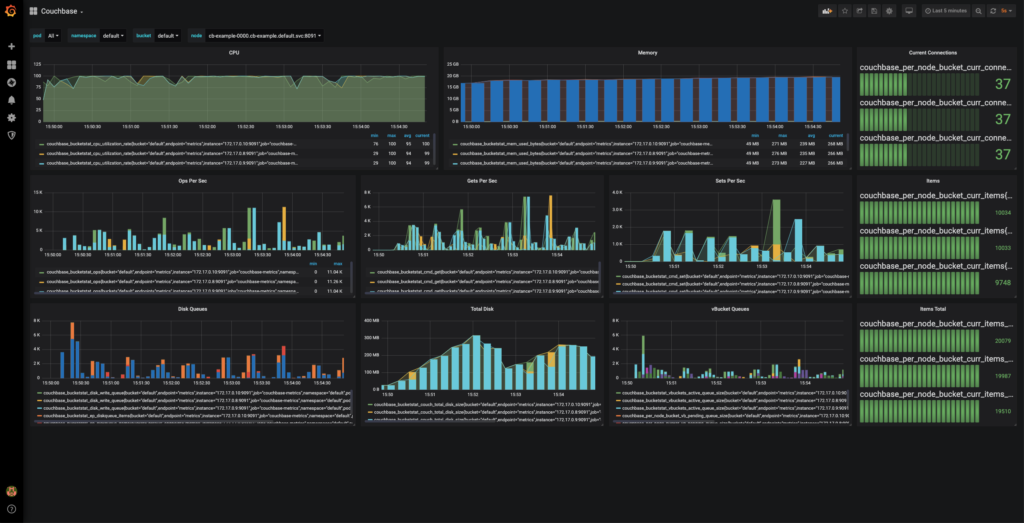
Which can be used to create dashboards like this.
At a component level, it comes together like this:
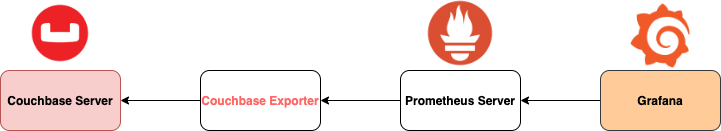
Let’s go into a little bit more detail about each component.
Couchbase Exporter
At its essence, the Couchbase Exporter provides the first building block in this workflow by providing Prometheus endpoints that are pulled at an interval defined by Prometheus server. It does this while also offering options for network security with TLS and mTLS and protection of any potential sensitive data from the exporter via a bearer token.
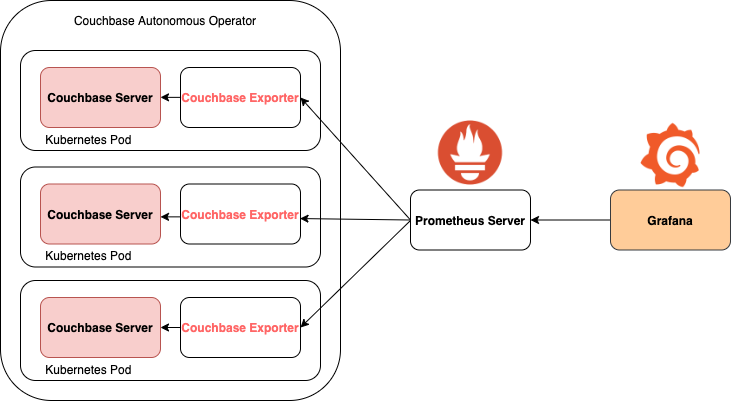
Whilst running within the Autonomous Operator, the Couchbase Exporter lives as a sidecar on each Kubernetes Pod, maximising local networking when it comes to specific node statistics and reducing the amount of intracluster traffic. As well as providing a degree of redundancy; if one pod goes down, overall cluster statistics and statistics on the active pods persist.
This does mean that each node running Couchbase has to run a copy of the exporter in order for these per-node statistics to be available. Each copy of the exporter will then only pull per-node statistics from the node it is running on. Each one of these exporters will then each run an endpoint available for any Prometheus Server to scrape, once configured.
Prometheus
Prometheus is an Open Source systems monitoring and alerting toolkit, and the 2nd project to join the CNCF after Kubernetes, so it is a natural fit for Kubernetes environments and widely-adopted.
It’s more of a protocol and toolkit to populate a time-series database and not a dashboard tool. A lightweight ability to graph statistics is present but it is more common to use Grafana.
Grafana
In order to visualise the data collected by Prometheus we can use the incredibly flexible Grafana which consumes the Prometheus API to create customizable dashboards. Grafana is an open source data visualisation and alerting platform, mostly used to build incredibly comprehensive and user-customizable dashboards.
Dashboards can be pretty specific to what you as a user care about, so you’ll want to customise accordingly. If you want a starting point, there are a few sample Grafana dashboards in the couchbase-exporter GitHub repo which will be improved over time. Contributions certainly welcome!
Installation
To get everything working, you will need to set up the four main components in this monitoring pipeline, Couchbase Server itself, the Couchbase Exporter, Prometheus and Grafana.
The exporter is compatible with Couchbase Server versions 5.5.x onwards, but we would recommend to use version 6.0.4 or newer due to the upcoming EOL of 5.x.
Grafana Configuration
To install and set up Grafana, choose your relevant platform and follow the installation guide. Once that’s running, when we first load up Grafana at https://localhost:3000 it will ask for a username and password, which is “admin” for both. It will then ask you to set a new password.
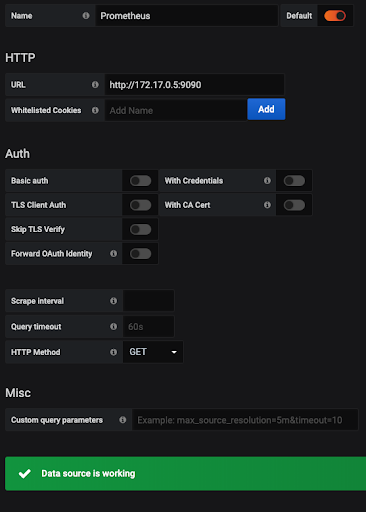
The next step is to add Prometheus as a Data Source. Depending on where you are running Prometheus, the HTTP URL address will be localhost or the address where you’ve hosted or exposed it, with the port 9090. Below is an example of Prometheus running in Docker.
Then we can import one of our sample dashboards to visualise our data. To import the dashboard of your choice, hover over to the plus icon on the left sidebar and select “Import”. As a starting point, copy and paste the JSON provided in the exporter Grafana folder and then hit Load.
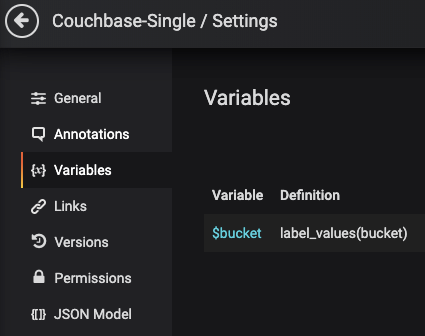
You may need to go to Settings -> Variables -> bucket and hit Update for the correct buckets to load and for data to appear.
Security
The exporter supports communication over TLS and mTLS as well as restricting who sees the metrics information through usage of a bearer token flag. In conjunction with the Couchbase Operator, the bearer token is supplied as a Kubernetes Secret. TLS and mTLS are enabled by enabling these on the overall cluster. An example of a bearer token as a Secret:
|
1 2 3 4 5 6 7 |
apiVersion: v1 kind: Secret metadata: name: cb-metrics-token type: Opaque stringData: token: your-plain-text-bearer-token-here |
In standalone, supply the location of a token file using the flag “–token”, and similar for any PKI resources using the flags “–key”, “–cert” and “–ca”, where “–key” refers to the private key to be used, “–cert” the certificate chain, and “–ca” the top-level certificate authority.
Running Standalone
While not officially supported yet, as mentioned it’s certainly possible to run this as a process or as a Docker container alongside your Couchbase Server nodes.
For the exporter, download the source code from the couchbase/couchbase-exporter GitHub repo.
|
1 |
git clone https://github.com/couchbase/couchbase-exporter.git |
Alternatively you can pull the official Dockerhub image found here.
|
1 |
docker pull couchbase/exporter |
However this may not always be up to date whereas the git repository will be.
To run the exporter locally simply use the command
|
1 |
docker run --name couchbase-exporter -d -p 9091:9091 couchbase-exporter:1.0.0 |
Follow the instructions found in the README for any more advanced configurations.
You can run Prometheus both locally and through Docker, much like the exporter.
Download and run Prometheus locally, then use our provided prometheus.yml which contains the scrape_config job that includes a look-up for localhost:9091 – which is where the exporter metrics should be served if running locally. If not, edit the file accordingly if needed so that the scrape_config job includes the correct IP address for the exporter.
– job_name: ‘couchbase’
# both these values can be set to a minimum of 1s granularity if such precision is needed
scrape_interval: 60s
scrape_timeout: 55s
metrics_path: /metrics
static_configs:
– targets: [‘localhost:9091’]
To run through Docker, make sure your prometheus.yml file is correct, and then run one of the following commands:
|
1 2 3 4 |
docker run \ -p 9090:9090 \ -v /path/to/config/prometheus.yml:/etc/prometheus/prometheus.yml \ prom/prometheus |
|
1 2 3 4 |
docker run \ -p 9090:9090 \ -v /path/to/config:/etc/prometheus \ prom/prometheus |
With the flag -d if you wish to run the image detached in the background.
Source: https://prometheus.io/docs/prometheus/latest/installation/#using-docker
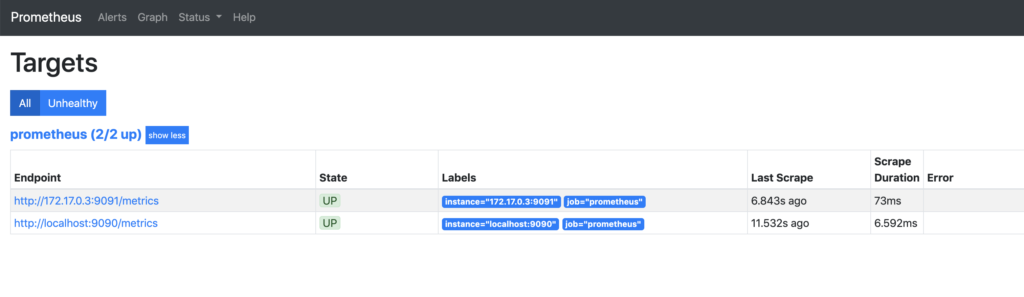
Run prometheus and the exporter which hosts metrics at localhost:9091/metrics, and the exporter URL should appear on the list of Prometheus targets at localhost:9090/targets and report as UP.
If you are running both the exporter and Prometheus in Docker, the setup is slightly more complicated. Use the commands docker network list and docker network inspect <network-ID> to find the IPv4 Address of the Couchbase Exporter container and substitute this value for localhost in the list of scrape targets.
What’s Next
One of the aims of this project is to provide an official Prometheus Exporter for Couchbase. Because of the Open Source nature of Prometheus and the exporters that existed before, we want to actively encourage community contributions to the project.
For any bugs, issues or feature requests, please use our JIRA.
A special mention to Carlos Becker and the rest of the contributors on the TOTVS Labs couchbase exporter project as well as the Leansys couchbase exporter for providing the baseline inspiration for this project!
Further Resources
With the release of Autonomous Operator 2.0, a tutorial is provided in the docs.
As of time of writing one of the simplest ways to set up Prometheus and Grafana is to use the Prometheus Operator. The linked tutorial covers the kube-prometheus GitHub project and its corresponding Helm chart.
https://github.com/coreos/kube-prometheus
https://github.com/helm/charts/tree/master/stable/prometheus-operator
https://github.com/coreos/prometheus-operator