Capella App Services is a fully managed backend as a service (BaaS), that is specifically tailored to mobile, IoT and edge applications. It empowers developers and organizations to seamlessly integrate with Couchbase Capella and synchronize data across various edge applications utilizing Couchbase Lite.
Although Capella App Services is a managed environment, monitoring provides valuable insights and control. It enables you to track key metrics about resource utilization, throughput, error rates and many more, thus assisting in the identification of performance bottlenecks and scalability concerns.
Additionally, proactive issue detection through alerting minimizes downtime of applications end-to-end and ensures continuous operation. Capacity planning also becomes more effective with monitoring, as you analyze resource usage patterns and make informed decisions about scaling infrastructure and optimizing cost.
In this blog post, we’ll explore how you can easily monitor Capella App Services using Prometheus metrics and Grafana. We’ll guide you through the process of setting up Prometheus to collect and store metrics from Capella App Services. Moreover, we will demonstrate how to leverage Grafana to create compelling dashboards that provide real-time insights into the performance of behavior of your applications.
Prerequisites
Before diving into the tutorial, ensure that you have the following prerequisites in place:
- A deployed Capella App Service and a configured App Endpoint.
- Docker installed on your local machine.
Background
Capella App Services Web UI Metrics
Capella App Services offers monitoring capabilities right out of the box through its Web UI, see the Monitoring App Endpoints docs. The Monitoring tab within the Web UI provides an intuitive interface to graph various metrics related to the volume and throughput of documents being synced through App Services and for a given App Endpoint. These metrics include:
- App Services Node level:
- Bytes sent and received by node
- CPU and memory utilization
- App Endpoint level:
- Total authentication failures and successes
- Delta syncs requested and sent
- Total documents imported, read, written, and rejected
- Number of active pull-only replications
Capella App Services Metrics API
While the Web UI provides a comprehensive set of metrics, you may require more granular and customizable information to meet your specific monitoring needs. In such cases, the App Services Metrics API can be utilized. This API provides data in Prometheus format, allowing you to fetch a wide range of metrics programmatically.
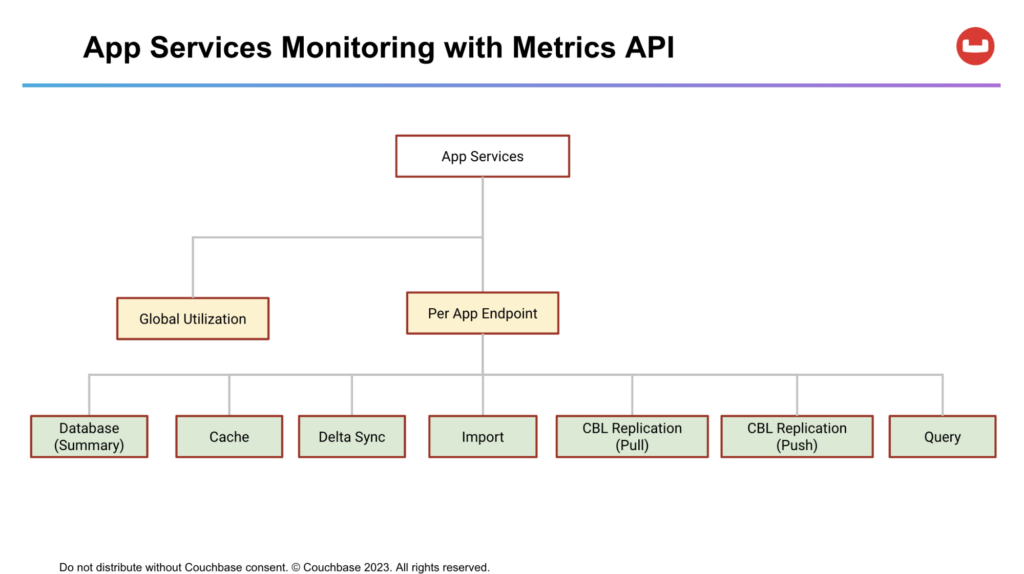
The App Services Metrics API offers a way to access real-time metrics related to Capella App Services. It provides a comprehensive set of metrics at different levels to monitor and analyze the performance of the system.
These metrics include global cluster utilization stats, which give insights into the overall resource consumption of an App Services Node. An App Service instance consists of multiple nodes.
For each node, the API also offers per-App Endpoint metrics, allowing users to examine the specific performance characteristics and utilization patterns of individual endpoints within a node. These metrics include Cache utilization, Delta Sync, Import, Couchbase Lite Replication (Push and Pull) and Query related metrics.
Prometheus
Prometheus is an open source systems monitoring and alerting platform hosted by Cloud Native Computing Foundation. At the core of it is the Prometheus Server that is responsible for polling “Prometheus targets” for metrics and storing it as time series data. Prometheus targets are statically configured or can be discovered by Prometheus.
Grafana
Grafana is an open source data visualization and alerting platform. It supports Prometheus as a data source and can be used to build comprehensive dashboards.
Deployment Architecture

- Prometheus Server continually polls the Metrics API that returns Prometheus format for metrics. The server uses the rules defined in the rules.yaml to push alerts to the Alerting Manager.
- Grafana service polls the Prometheus Server for metrics and graphs it on a web-based dashboard that can be accessed via the Web browser.
Configure Capella App Services for Metrics Access
Before proceeding with this step, it is important to ensure that you have Capella App Services set up and running. If you haven’t done so already, you can follow the detailed tutorials provided by Capella to set up a sample database, import relevant data, and create an App endpoint. This will ensure that you have the necessary foundation in place to effectively follow along with this tutorial.
Firstly, go to the Connect screen of an App Endpoint:
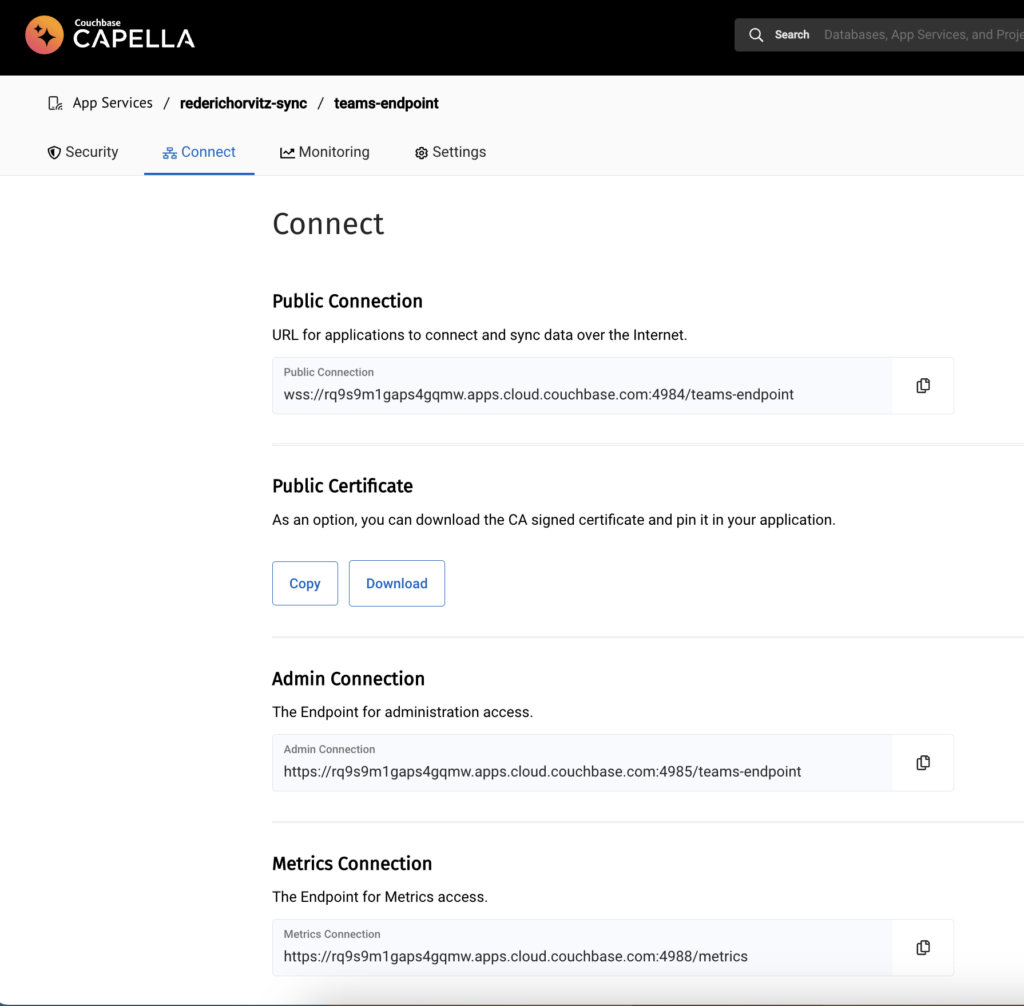
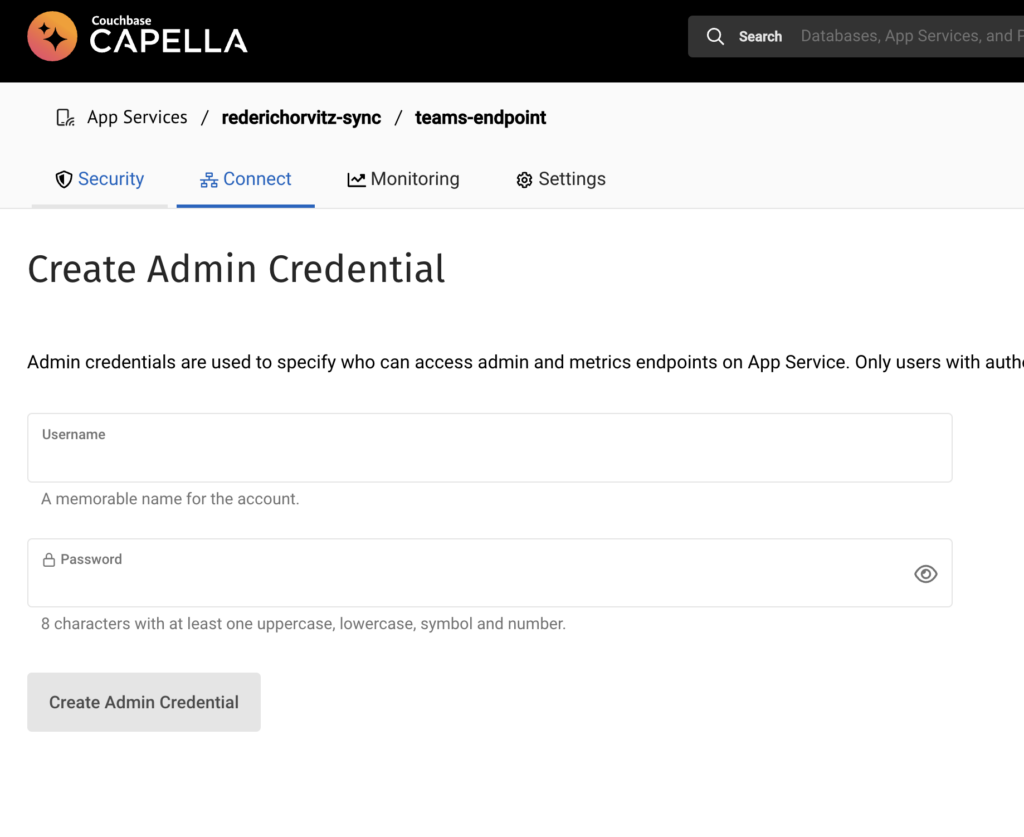
Setting up Admin Credentials: Set up admin credentials for your App endpoint. This ensures that only authenticated users with admin privileges can access the admin and metrics endpoints. Implementing authentication is highly recommended as it enhances the security of data access through the Metrics API.
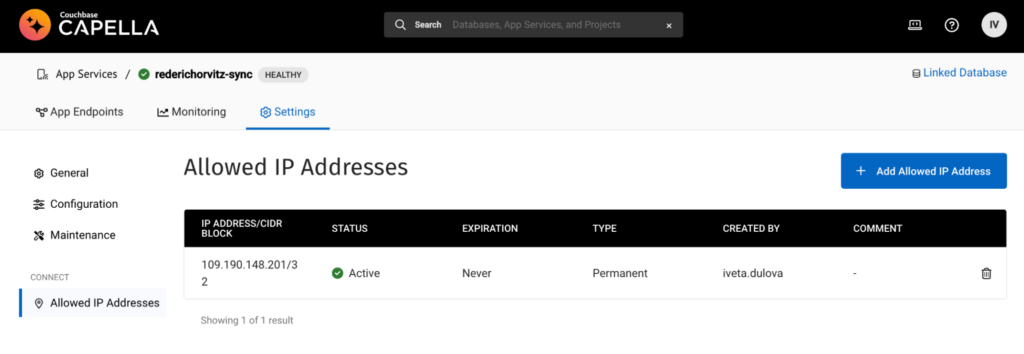
Configure Allowed IP Addresses: To allow the host to pull metrics from the Capella App Services Metrics API, you need to add its IP address to the “Allow IP Addresses” configuration. Make sure to provide the IP address in CIDR format. This step ensures that the designated host is permitted to access and retrieve metrics from the API.
Validate Metrics URL Access: Try out the Metrics API endpoint locally using cURL to verify you have access to the metrics with the supplied username and password, e.g. curl -u username:password metricsEndpointUrl.
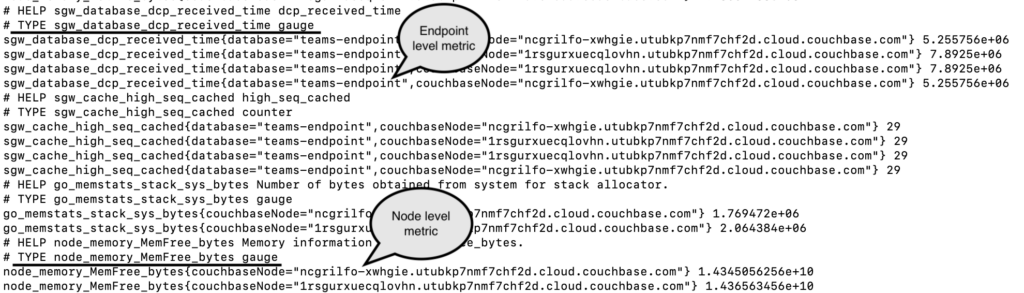
In the output above, we can observe per endpoint metrics that offer insights into specific App Services endpoints. One such metric, sgw_database_dcp_received_time, measures the time it takes for a document to be received by Sync Gateway over DCP after a write operation. These per endpoint metrics are prefixed with sgw_database and have separate entries for each of the App Services nodes and endpoints.
Additionally, the Prometheus format Metrics API provides per node metrics that allow monitoring of global node utilization. These metrics encompass various aspects such as memory usage, CPU utilization, and heap and stack statistics. Prefixed with node, these metrics offer information specific to individual nodes. For instance, a metric like free memory bytes indicates the amount of available memory on a particular node.
Above can be seen examples of per endpoint metrics, such as sgw_database_dcp_received_time, which indicates the time between a document write and that document being received by Sync Gateway over DCP. Per endpoint metrics are prefixed with sgw_database and have separate entries for each of the App Services nodes. There are also per node metrics such as global node utilization metrics, e.g. memory, CPU, heap and stack related stats. These are prefixed with node, such as the free memory bytes example in the screenshot.
Consumers can aggregate and transform these metrics to be per App Endpoint depending on their use case.
Setting up Monitoring Framework
In a real world scenario, a monitoring framework would typically be set up in your data center or in the cloud. However, for this discussion, we’ll be using a local dev machine. This serves as a controlled environment to understand the setup before implementing it on a larger scale. For a practical guide, see Amazon CloudWatch’s Prometheus integration for EC2: CloudWatch Agent PrometheusEC2.
Creating a Docker network
When using Docker, it is recommended to run all the components on the same Docker network. Create a Docker network named monitoring: docker network create monitoring
Setting up Prometheus
- Pull the latest Prometheus Docker image: docker pull prom/prometheus
- Create a local prometheus.yml configuration file and modify it to contain the following:
|
1 2 3 4 5 6 7 8 9 10 11 12 |
global: scrape_interval: 5s evaluation_interval: 5s scrape_configs: job_name: app–services metrics_path: /metrics scheme: https basic_auth: username: {{admin_username}} password: {{admin_password}} static_configs: – targets: [‘{{target_app_services_metrics_url}}’] |
Replace the placeholders {{admin_username}} and {{admin_password}} with the admin credentials you created in the Configure Capella App Services Metrics API section.
The {{target_app_services_metrics_url}} refers to the Metrics endpoint URL, which can be found under the Connect tab of your App endpoint. When adding this URL to the Prometheus configuration targets array, make sure to remove the protocol (https://) as it is already specified in the scheme: https field. In addition, remove /metrics from the URL as it is specified under metrics_path.
Optional: If you wish to use the Prometheus App Services metrics to define alerts for events such as auth failures, document access, you can create a local rules.yml configuration file inside a /rules directory and use some of our examples as a starting point, but you can customize the file and add more alerts based on the App Services metrics from the Metrics API.
In addition, you should include rule_files in your prometheus.yml configuration, see example below. The path /etc/prometheus/rules/* indicates the location of the rule files within the Prometheus container and it is relative to the container’s file system.
|
1 2 3 4 5 6 7 8 9 10 11 12 13 14 15 16 17 18 19 20 21 22 23 24 25 26 27 28 29 30 31 32 33 34 35 36 |
rule_files: – ‘/etc/prometheus/rules/*’ groups: – name: app–service.rules rules: – record: sgw::gsi::total_queries expr: sum by (instance, database, job) ({__name__=~“sgw_gsi_views_.*_count”}) – alert: TooManyDocumentAccessFailuresInLastHour expr: deriv(sgw_security_num_access_errors[1h]) > 1000 for: 1m labels: severity: warning annotations: summary: Too many Document Access Failures in Last Hour – alert: TooManyDocumentRejectionFailuresInLastHour expr: deriv(sgw_security_num_docs_rejected[1h]) > 1000 for: 1m labels: severity: warning annotations: summary: Too many Document Rejection Failures in Last Hour – alert: GlobalErrorCount expr: increase(sgw_resource_utilization_error_count[1h]) > 1 for: 1m labels: severity: warning annotations: summary: An error occurred in the last hour – alert: WarnXattrSizeCount expr: increase(sgw_database_warn_xattr_size_count[1h]) > 0 for: 1m labels: severity: warning annotations: summary: A document had larger sync data than the maximum allowed by xattrs in the last hour |
These rules will serve as triggers for Prometheus alerts. For detailed guidance on writing alerts in Prometheus, refer to the Prometheus Alerting rules documentation.
Start the Docker Prometheus container using the following command. Modify to suit your context:
|
1 |
docker run –p 9090:9090 —name prometheus –d –v `pwd`/prometheus.yml:/etc/prometheus/prometheus.yml —network=monitoring prom/prometheus |
- –name prometheus: This parameter sets a custom name for the container. In this case, the container is named prometheus. You can refer to this name when interacting with the container later on.
- -d: This parameter runs the container in detached mode, meaning it runs in the background and doesn’t attach to the terminal.
- -v
pwd/prometheus.yml:/etc/prometheus/prometheus.yml: This parameter specifies a volume mount, allowing you to map a file or directory on the host machine to a location inside the container. This allows you to provide a custom configuration file for Prometheus. - (Optional) -v pwd/rules:/etc/prometheus/rules: This parameter specifies another volume mount, mapping the rules directory from the rules directory on the host machine to the /etc/prometheus/rules path inside the container. This allows you to provide custom rule files for Prometheus.
- –network monitoring: Specifying that Prometheus should be connected to the “monitoring” network.
- prom/prometheus: This is the name of the Docker image that will be used to create the container. In this case, it uses the prom/prometheus image from Docker Hub.
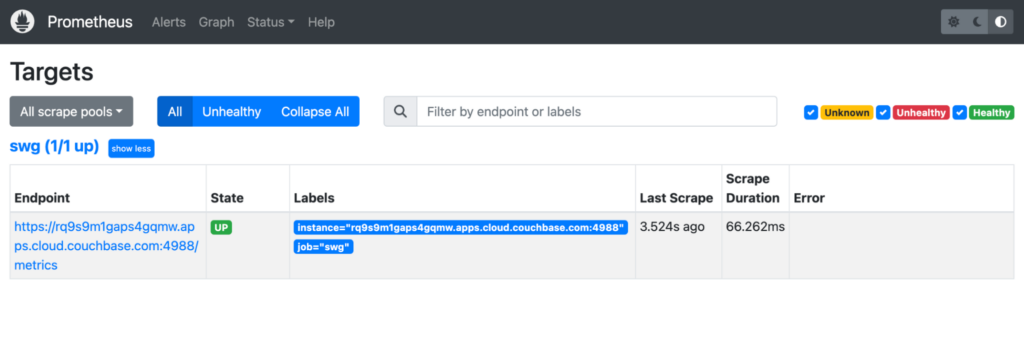
You should now be able to open the Prometheus Dashboard in https://localhost:9090 and verify that the target is responding with State=UP. Prometheus targets are the endpoints or services that Prometheus scrapes for metrics. When a target is labeled as state: up in Prometheus, it means that Prometheus successfully reached and scraped the target, and it is considered healthy and available.
Visualizing Metrics
Using Prometheus Web UI
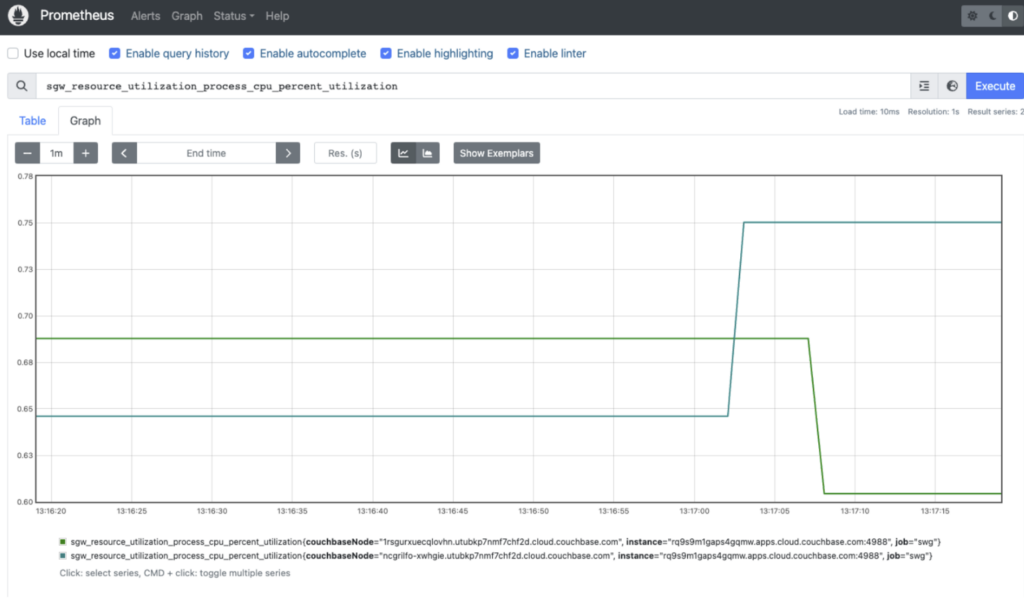
Now, you can visualize the data from the Metrics API of your App endpoint using the Prometheus Web UI on localhost. The Metrics API provides a wide range of available metrics that can be explored using the Prometheus Metrics Explorer. You can click on the Graph tab and then select one of the attributes from the drop-down, e.g. sgw_resource_utilization_process_cpu_percent_utilization and click Execute.
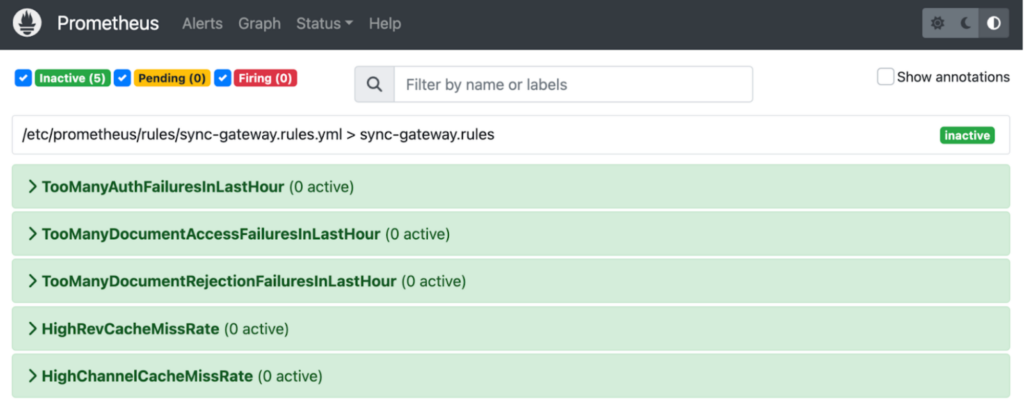
Optional: If you have opted in for creating a rules.yml file with alerting rules, the custom alert rules are included in the Docker image and mounted at /rules:/etc/prometheus/rules. As a result, these alerts can now be easily observed on the Prometheus Web UI.
Using Grafana
Instead of using Prometheus’s web interface to visualize the statistics, we will utilize Grafana since it provides the ability to create captivating dashboards and seamlessly integrates with Prometheus. To start Grafana and consume metrics from your containerized Prometheus server, you can follow these steps:
Pull latest Grafana Docker image:
|
1 |
docker pull grafana/grafana |
Start the Grafana Prometheus container using the following command and modify to suit your context:
|
1 |
docker run –d –p 3000:3000 —name grafana —network monitoring grafana/grafana |
By default, when the Grafana container is killed or stopped, the data stored within the container will be lost. You can use a database to persist the dashboards and other essential metadata. For more information, refer to the Grafana documentation.
Open the URL https://localhost:3000 in a web browser. You should see the Log In screen. Log in with the default credentials of admin and password of admin. You can change it after the initial login.
Add Prometheus as a data source: In the Grafana UI, go to the Configuration section and select Data Sources. Click on Add Data Source and choose Prometheus as the data source type. Configure Prometheus data source: Provide the necessary details to configure the Prometheus data source.
Set the URL to https://{{containerIPAddress}}:9090 (assuming your containerized Prometheus server is running on port 9090), where {{containerIPAddress}} can be obtained by the following command:
|
1 |
docker inspect –f ‘{{range .NetworkSettings.Networks}}{{.IPAddress}}{{end}}’ <container_id_or_name> |
Configure any other settings as required and click Save and Test to verify the connection to Prometheus.
Once the connection is established with the Prometheus Data Source, we can proceed to build Grafana dashboards. To import a dashboard from the Grafana UI, go to the Dashboards section and click on Manage to access the dashboard management page. Click on Import to import a new dashboard. Here is an example dashboard.json to get you started, which includes dashboards for most of the Metrics API core stats.
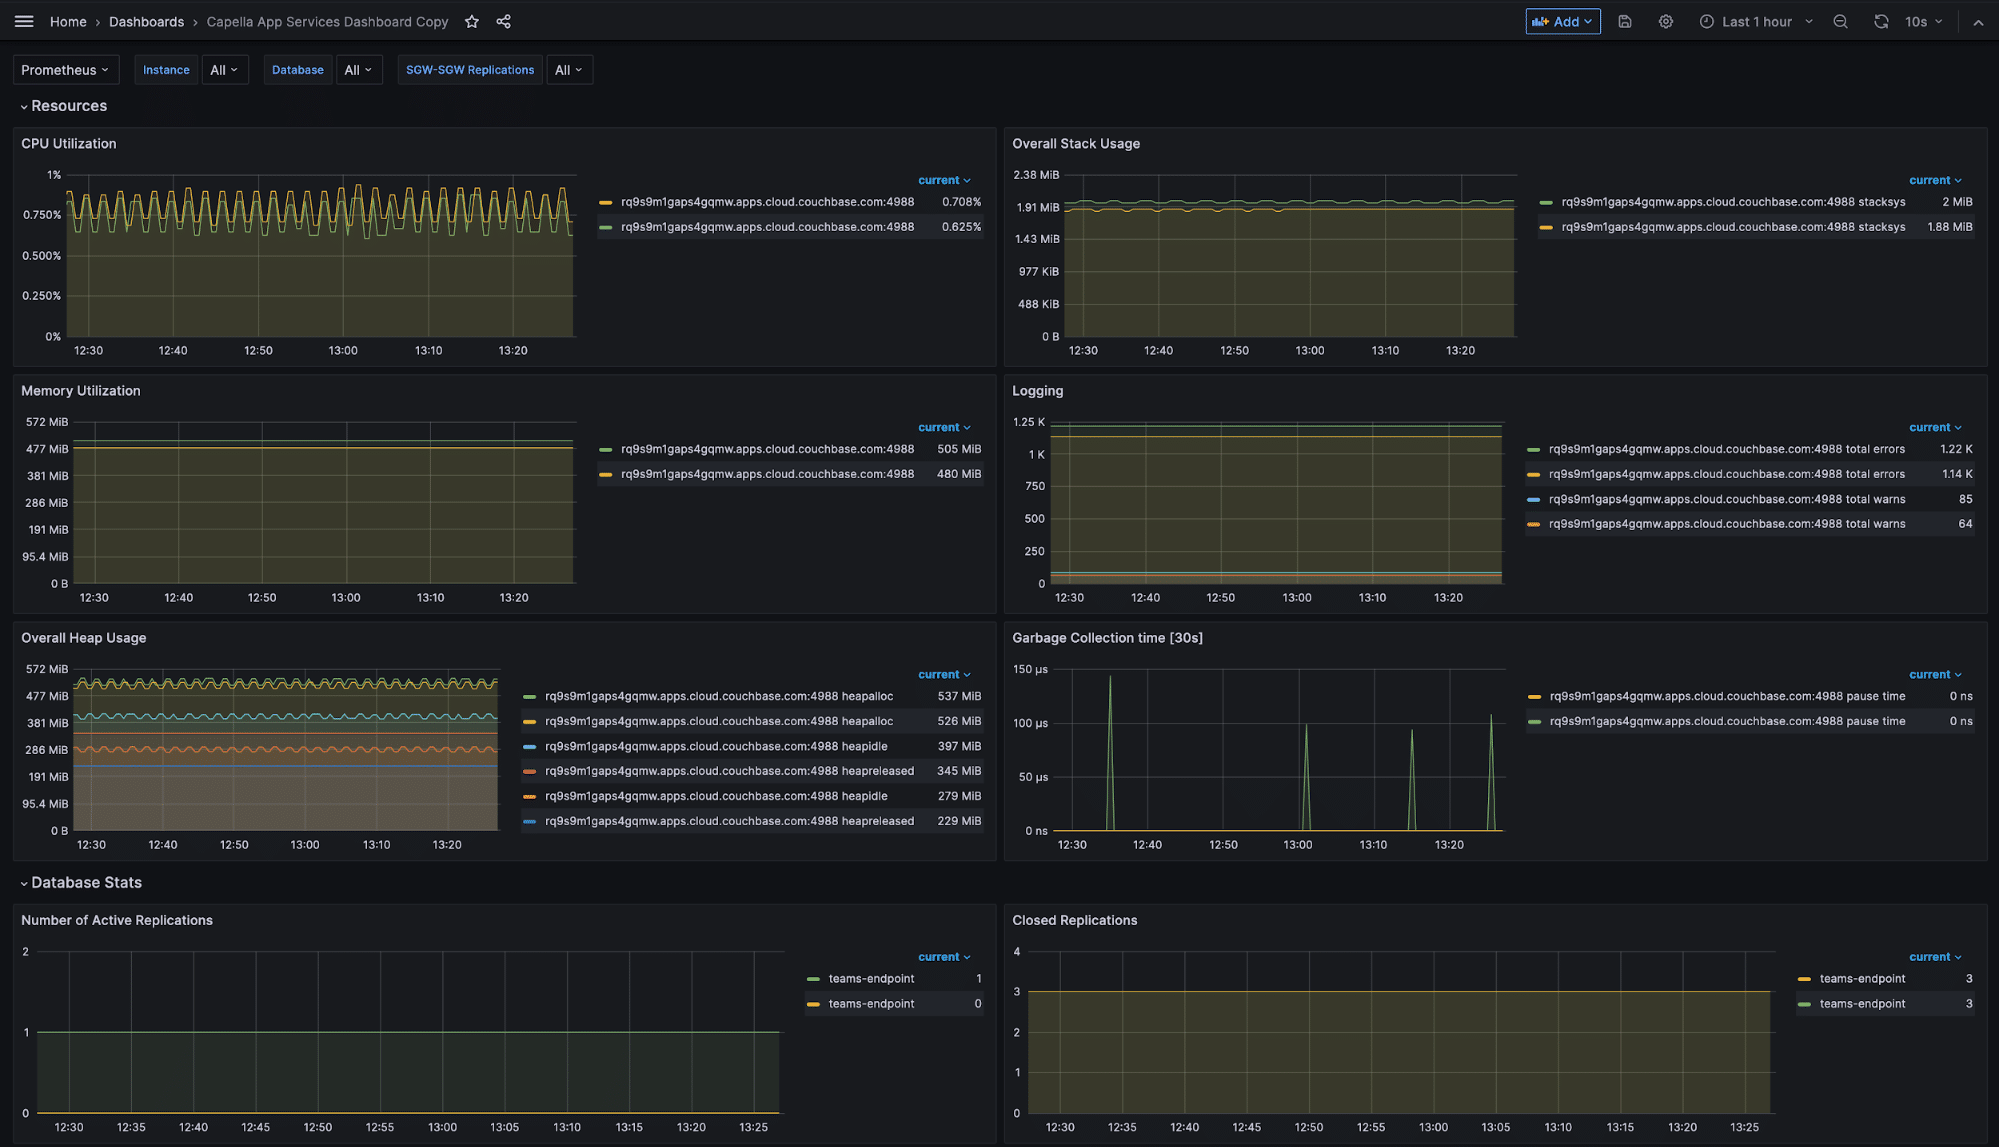
After the import process finishes, you will have the ability to view and interact with the imported dashboards within Grafana. These dashboards are connected to your containerized Prometheus server, which is configured as a data source in Grafana. To access the metrics, navigate to the Dashboards section and select the recently imported dashboard. In some cases, you may need to initially re-execute the queries associated with the dashboard to fetch the latest metrics.
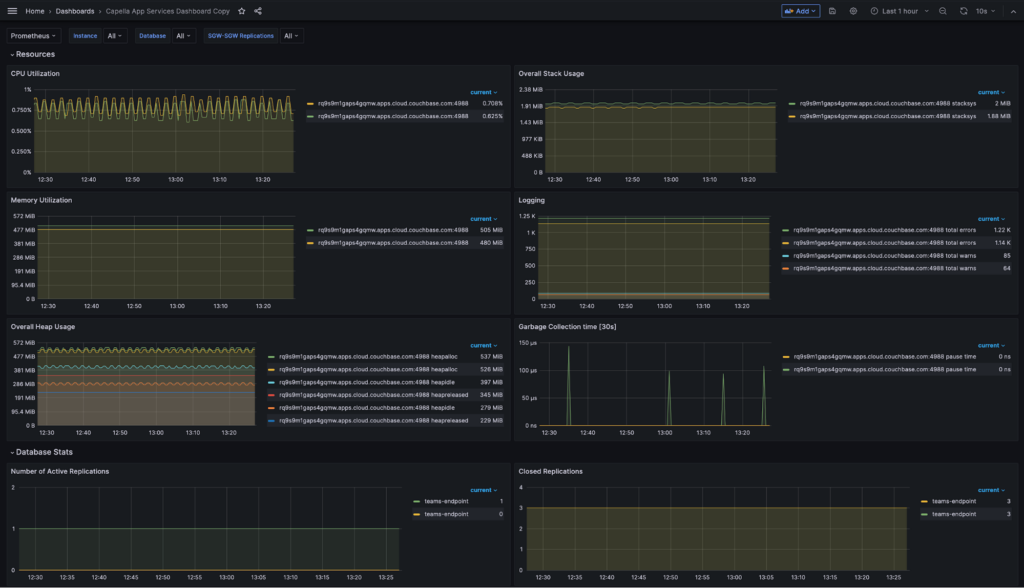
That’s it! You have successfully set up monitoring with Prometheus and Grafana for Capella App Services. You can now drive replications with Couchbase Lite clients and monitor it. The default Sync Gateway dashboard is a starting point. You can customize the dashboard, either by editing the dashboard.json file or directly through the Grafana UI.
Conclusion
In conclusion, the utilization of the Metrics API, coupled with the deployment of Prometheus and Grafana, allows for powerful, real-time monitoring of Capella App Services metrics. This integration equips you with the ability to promptly detect and address anomalies through custom alert rules, leading to enhanced application resilience. By harnessing these technologies, you can optimize performance and gain meaningful insights for your Couchbase applications.
If you have questions or feedback, please leave a comment below or feel free to reach out to me at iveta.dulova@couchbase.com. The Couchbase Forums are another place where you can reach out to us. We value your thoughts and look forward to hearing from you.
Leave a comment
You must be logged in to post a comment.