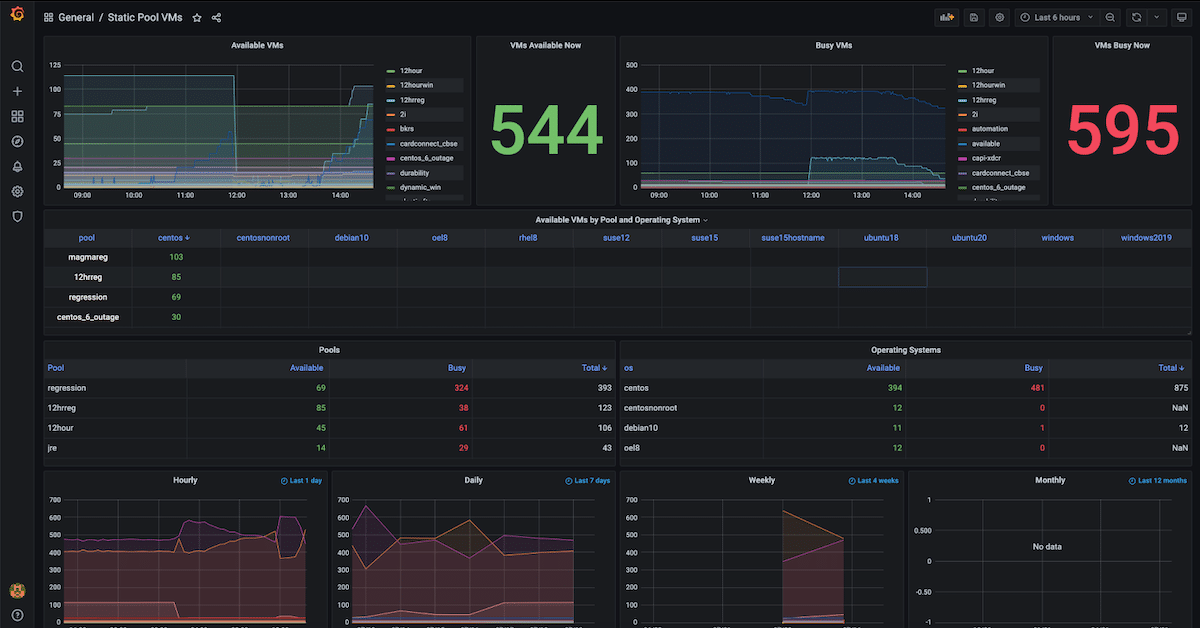
How to Build Observability Dashboards with Prometheus, Grafana & Couchbase
In this blog, we take you through the process you need to follow to build your own observability dashboard using Prometheus, Grafana and Couchbase.
Top Posts
- Data Modeling Explained: Conceptual, Physical, Logical
- Data Analysis Methods: Qualitative vs. Quantitative Techniques
- What are Embedding Models? An Overview
- Build a Celebrity Look-Alike App With Multimodal Vector Search an...
- What Is Data Analysis? Types, Methods, and Tools for Research
- Application Development Life Cycle (Phases and Management Models)
- A Story of How Multimodel Databases Can Reduce Data Sprawl (Told...
- A Breakdown of Graph RAG vs. Vector RAG
- Reduce TCO By 10x Using Couchbase 7.1 For Large Multi-Terabyte Da...