
Data analysis is a crucial step in extracting meaningful insights from collected data. Two common approaches to analyzing data are qualitative and quantitative analysis. Each method offers different techniques for interpreting and understanding your findings.
This blog post will further explore different qualitative and quantitative analysis methods, their strengths and limitations, and how to apply them in various research and business contexts. Whether you’re a researcher, analyst, or decision maker, understanding these methods will help you make informed decisions when analyzing data and deriving valuable insights.
Why Is Data Analysis Necessary?
Data analysis is comparable to a detective looking for evidence to uncover important information. It helps us understand trends and patterns in data that we may not see immediately. Analyzing data allows us to make better decisions, find opportunities, and solve problems. It’s necessary because it helps make sense of the large amounts of data available today. Data would be messy and hard to understand without analysis. With data analysis, we can find connections, discover abnormalities, and understand the bigger picture.
It also helps us predict the future by looking at past data. Historical data is useful in fields like business, finance, and healthcare. It allows us to predict customer behavior, market trends, and potential risks. With this information, we can plan and prepare for what might happen. Data analysis also improves performance and efficiency. By studying data, we can find areas to fix or improve, making things run smoother and using resources wisely.
Typical Data Analysis Steps
Data analysis involves several key steps to extract meaningful insights from data. Here’s an overview of the typical data analysis process:
- Objective Definition: Clearly define the objective of the analysis by understanding the specific questions to answer or problems to solve.
- Data Collection and Preprocessing: Gather relevant data from various sources, ensuring accuracy, completeness, and representativeness. Clean the data by removing errors, inconsistencies, or missing values, and preprocess it as needed (e.g., normalization, standardization).
- Exploratory Data Analysis (EDA): Explore the data through visualization, charts, graphs, and summary statistics to identify patterns, trends, or relationships and gain initial insights.
- Data Analysis Techniques: Depending on the data’s objective and characteristics, suitable techniques like descriptive statistics, hypothesis testing, regression, clustering, or classification can be used to analyze data effectively.
- Interpretation and Communication: Analyze the output of the analysis techniques, interpret the findings in the context of the objective, and draw conclusions. Communicate the results effectively using visualizations, reports, or presentations to stakeholders or decision makers.
Throughout the process, it’s important to validate and verify the analysis by checking for consistency, conducting sensitivity analyses, or using peer review. Additionally, the data analysis process often involves iteration, allowing for refinement and improvement based on initial findings or feedback received.
What is the Difference Between Qualitative and Quantitative Data?
Qualitative and quantitative data are two different types of data used in research and analysis. Here are the key differences between them:
| Qualitative Data | Quantitative Data | |
|---|---|---|
| Nature of Data | It consists of non-numerical or categorical information, such as descriptions, opinions, observations, or narratives. It focuses on capturing subjective or qualitative aspects of a phenomenon. | It comprises numerical information that can be measured or counted. It deals with objective or quantitative aspects of a phenomenon. |
| Data Representation | It’s typically represented in the form of words, texts, images, or codes and can be organized into categories, themes, or patterns. | It’s represented as numbers or numerical values and can be organized into tables, graphs, charts, or statistical summaries. |
| Data Collection Methods | It’s collected through interviews, focus groups, observations, or open-ended survey questions. It aims to gather in-depth insights and capture the richness of human experiences. | It’s collected through surveys, experiments, or structured observations. It aims to gather data that can be analyzed statistically and generalize findings to a larger population. |
| Data Analysis Approach | It involves analyzing data thematically or by identifying patterns, themes, or commonalities. Techniques like coding, content analysis, or discourse analysis are commonly used. | It involves analyzing data using statistical techniques. It focuses on numerical relationships, patterns, or trends and involves computations, statistical tests, and modeling. |
| Outcome and Generalizability | It provides in-depth understanding, rich descriptions, and contextual insights. Findings may be specific to the studied context and not easily generalizable to a larger population. | It provides numerical measurements, statistical relationships, and quantifiable results. Findings can be generalized to a larger population within a certain level of confidence. |
Both qualitative and quantitative data have their strengths and applications. They can be used together in mixed-methods research to comprehensively understand a research topic or triangulate findings for more robust conclusions.
Data Analysis Methodologies
Data analysis methodologies refer to the techniques and approaches used to analyze and interpret data. These methods vary depending on the type of data you’re analyzing and the research objectives. Two common categories of data analysis methodologies are qualitative and quantitative.
Qualitative Data
Qualitative data analysis involves examining non-numerical or categorical information to uncover patterns, themes, and meanings. Here are some commonly used methods for analyzing qualitative data:
Thematic Analysis: Identifies recurring themes or patterns in qualitative data by categorizing and coding the data.
Content Analysis: Analyzes textual data systematically by categorizing and coding it to identify patterns and concepts.
Narrative Analysis: Examines stories or narratives to understand experiences, perspectives, and meanings.
Grounded Theory: Develops theories or frameworks based on systematically collected and analyzed data, allowing theory development to be guided by the analysis process.
Quantitative Data
Quantitative data analysis involves analyzing numerical data to uncover statistical patterns, relationships, and trends. Here are some commonly used methods for analyzing quantitative data:
Descriptive Statistics: Summarizes dataset features using mean, median, mode, standard deviation, and percentages.
Inferential Statistics: Draws conclusions about a population based on sample data using hypothesis testing, t-tests, and regression analysis.
Data Mining: Discovers patterns and correlations in large datasets using algorithms and statistical techniques.
Experimental Design: Designs controlled experiments to determine causal relationships between variables.
These are just a few examples of qualitative and quantitative data analysis methods. The choice of methodology depends on the research objectives, type of data, available resources, and the specific questions to address. Researchers often employ a combination of data analysis techniques to comprehensively understand the data and draw meaningful conclusions.
Data Analysis Obstacles
You’ll likely encounter obstacles to obtaining accurate and meaningful insights during the data analysis process. Understanding these obstacles is crucial for effective data analysis. Here are some common ones:
Data Quality Issues: Poor data quality can be a significant obstacle. Addressing data quality issues by carefully cleaning and preprocessing your data is essential.
Insufficient or Unrepresentative Data: If the data collected doesn’t cover the relevant variables or lacks diversity, the insights obtained may be limited or biased.
Lack of Domain Knowledge: Data analysis often requires domain knowledge to interpret the results accurately. Without a thorough understanding of the subject matter, it can be challenging to identify relevant patterns or relationships in the data.
Complexity and Volume of Data: Large and complex datasets can pose processing, analysis, and interpretation challenges. Analyzing such data requires advanced techniques and tools to handle the volume and complexity effectively.
Biases and Assumptions: Biases and assumptions made during data analysis can influence the process. Biases can occur at various stages, such as data collection, preprocessing, or analysis.
Overcoming these obstacles requires careful attention to data quality, ensuring representative data, acquiring domain knowledge, utilizing appropriate tools and techniques, and being mindful of biases and assumptions. By addressing these challenges, data analysts can enhance the reliability and validity of their analysis, leading to more accurate and insightful results.
How to Ensure Data Quality
It’s crucial to prioritize data quality to ensure that insights obtained from data analysis are accurate and reliable. Here are some simple steps to ensure data quality:
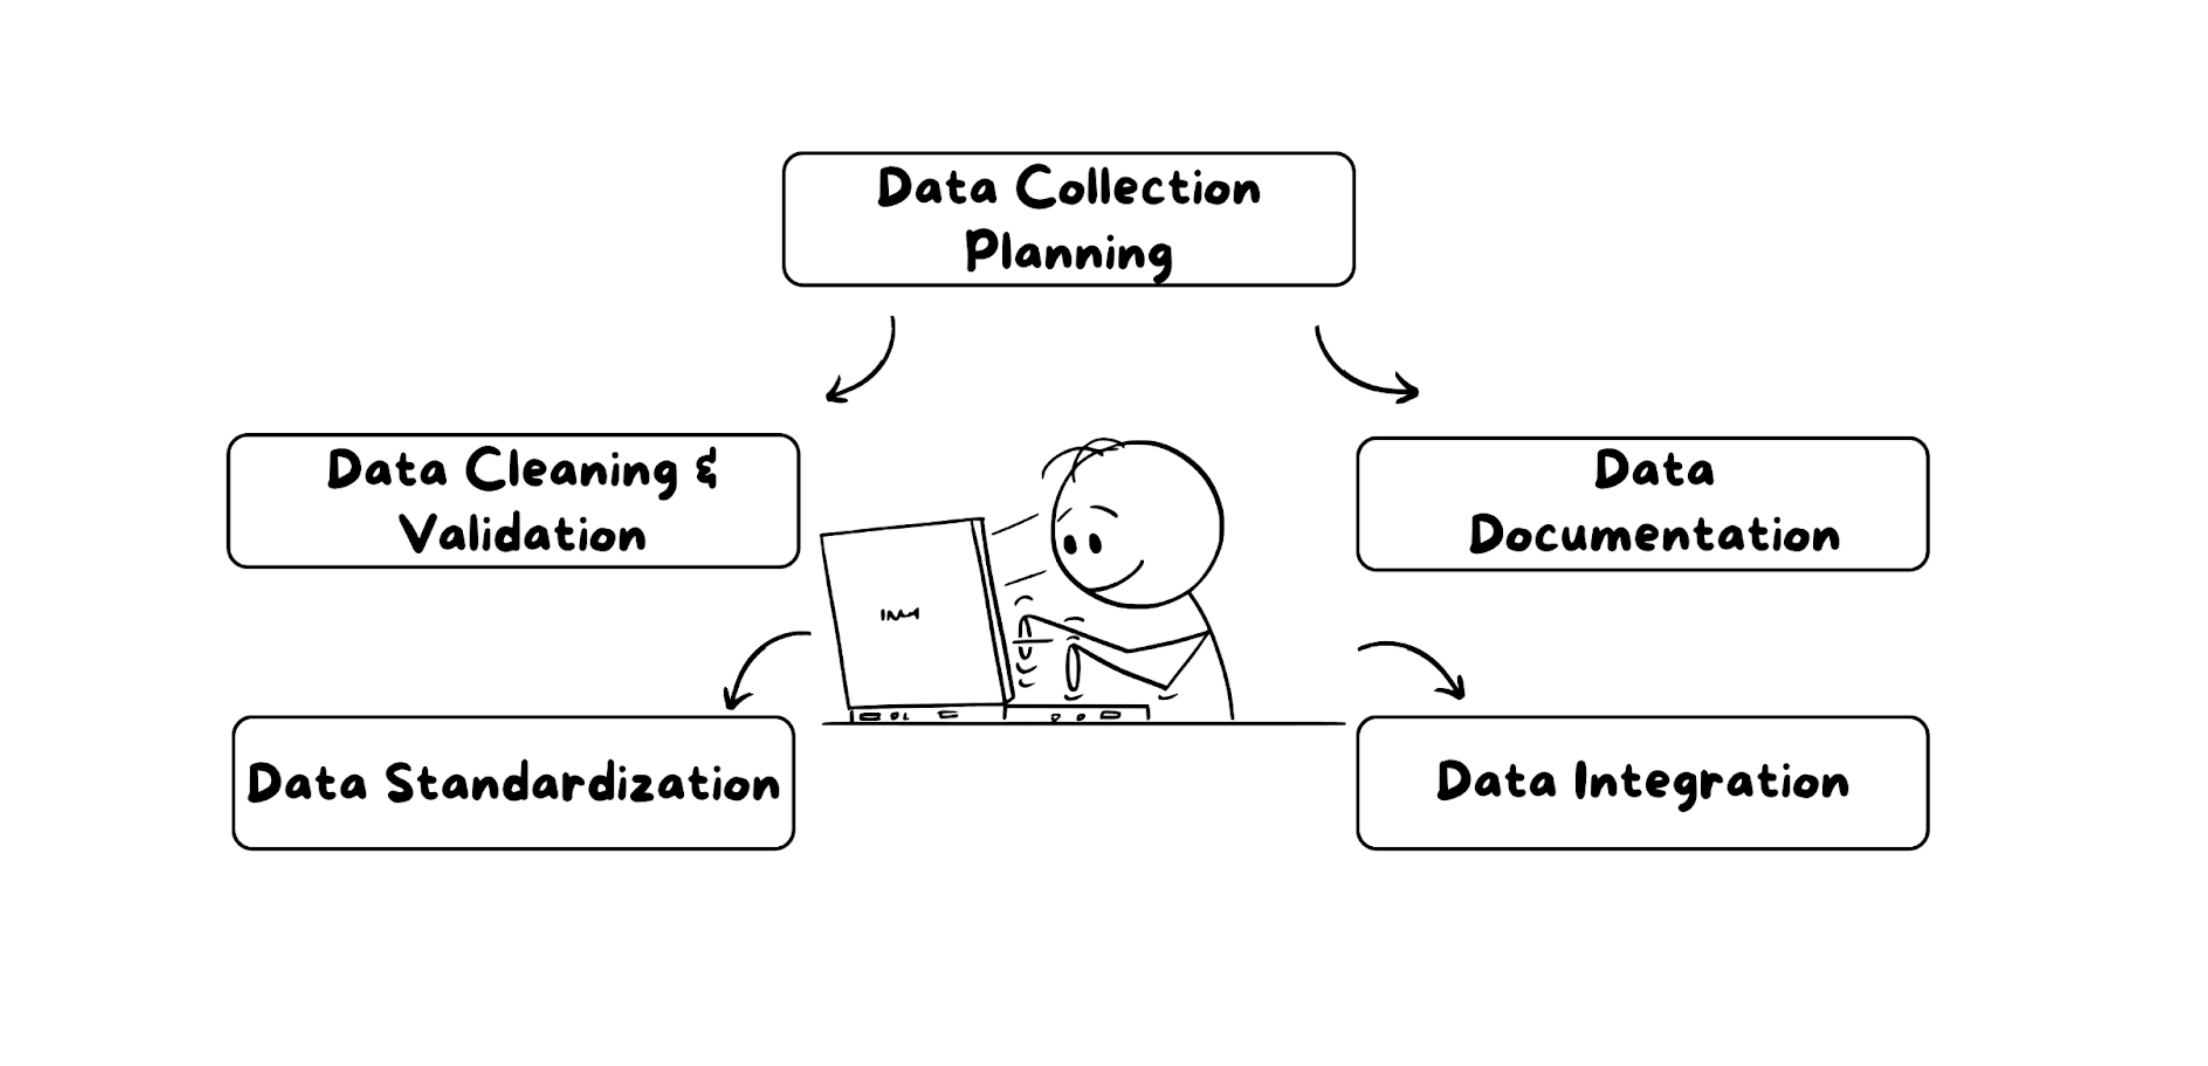
- Data Collection Planning: Plan the data collection process carefully. Clearly define the data requirements and variables needed to address the analysis objective.
- Data Cleaning and Validation: Thoroughly clean the collected data to remove errors, inconsistencies, or missing values. Validate the data by cross-checking it against known standards or conducting data verification checks.
- Data Standardization: Ensure consistency and comparability by converting data into a common format, unit, or scale.
- Data Integration: If working with multiple datasets, integrate them carefully to ensure coherence and accuracy. You should match variables, resolve inconsistencies, and merge all data correctly.
- Data Documentation: Thoroughly document the data collection and preprocessing procedures. Record data sources, data cleaning steps, transformations applied, and any other modifications made.
By following these steps, data quality can be maintained throughout the analysis process. High-quality data enhances the credibility of the analysis and enables informed decision making based on accurate and trustworthy information.
How Data Analysis Benefits Your Organization
Data analysis offers organizations numerous benefits, helping them improve processes, make informed decisions, and gain a competitive edge. Here are some key advantages of data analysis in clear and simple terms:
Informed Decision Making: Data analysis helps organizations make informed decisions by providing valuable insights and identifying trends and patterns in data.
Improved Efficiency and Productivity: By analyzing data, organizations can identify inefficiencies, streamline processes, and allocate resources effectively, improving efficiency and productivity.
Enhanced Customer Understanding: Data analysis enables organizations to gain a deeper understanding of customers and their needs, preferences, and behavior, enabling personalized marketing strategies and better customer service.
Competitive Advantage: Data analysis helps organizations stay ahead of the competition by identifying market trends, monitoring competitors, and uncovering new opportunities.
Risk Identification and Mitigation: Data analysis allows organizations to identify and mitigate risks by analyzing historical data, detecting potential fraud, predicting customer churn, and proactively developing risk management strategies.
In summary, data analysis empowers organizations to make informed decisions, improve efficiency, understand customers, gain a competitive advantage, and mitigate risks, leading to enhanced performance and success.
Key Takeaways
Data analysis is a powerful process that offers significant benefits to organizations. It enables organizations to improve efficiency, optimize processes, and allocate resources effectively, leading to cost savings and increased productivity. It also helps organizations better understand their customers, tailor strategies, and develop products that meet customer needs, fostering customer satisfaction and loyalty. Furthermore, data analysis provides a competitive advantage by uncovering market trends, monitoring competitors, and identifying new opportunities.
Check out the following resources to learn even more about data analysis:
- What is Big Data Analytics?
- Enterprise Analytics
- Unstructured Data
- Semi-Structured Data
- What is Data Management?
- What is a Data Platform?
- Database vs. Data Warehouse: Differences, Use Cases, Examples
- Couchbase Analytics Adds Real-time Data Analytics Service
- JSON Analytics Product Page
Leave a comment
You must be logged in to post a comment.