In this blog post, the first in a series, we’re going to show you how to set up a Prometheus server and connect it to your Couchbase Capella Database in order to collect metrics.
What is Prometheus?
Prometheus is a very popular open-source systems monitoring and alerting toolkit, with a very active developer and user community. It was originally built at SoundCloud, but is now a standalone open source project, maintained independently of any company, and it joined the Cloud Native Computing Foundation in 2016 as the second hosted project, after Kubernetes.
What is Couchbase Capella?
Couchbase Capella is our fully-managed Database as a Service (DBaaS) offering, the easiest and fastest way to begin with Couchbase and to eliminate ongoing database management efforts. Your Capella Database contains a native Prometheus scrape target, allowing you to connect your Prometheus (or Prometheus-compatible) monitoring systems to collect metrics.
Prerequisites
To follow the steps in this guide, you’ll need a working Docker installation (which we’ll use to deploy Prometheus), a Capella Database, and some common shell utilities.
Note: It is outside of the scope of this post to show how to install and configure Docker. There are many tutorials out there, including Docker’s own Get Started with Docker. We’ll assume at this point that you have successfully installed and tested it (with e.g. Hello, World!).
At the time of writing, the latest version of Prometheus was 2.46. The steps here were carried out using Rancher Desktop 1.9.1, with the Container Engine set to dockerd (moby), and using the provided docker CLI. The expectation is that the steps should work as is on any current Docker installation, or an equivalent stack such as containerd with the nerdctl CLI.
Lastly, the commands shared here are suitable for short-lived, standalone development environments – you should of course follow your local best practices for networking and security where appropriate.
Running a Prometheus Server in Docker
Let’s just jump right in and run the latest Prometheus container (prom/prometheus) with its default settings.
The docker run command has many options, but for this example we’ll just use a -p / –publish to expose the Prometheus port (which defaults to 9090) so that we can access it from our local browser, and an –rm to make sure that the container is cleaned up when it exits.
By default the running container will remain “attached”, streaming the logs to Standard Output (in this case, your terminal). Let’s do that for the first run so we can make sure it starts up correctly:
|
1 |
docker run —rm —publish 9090:9090 prom/prometheus |
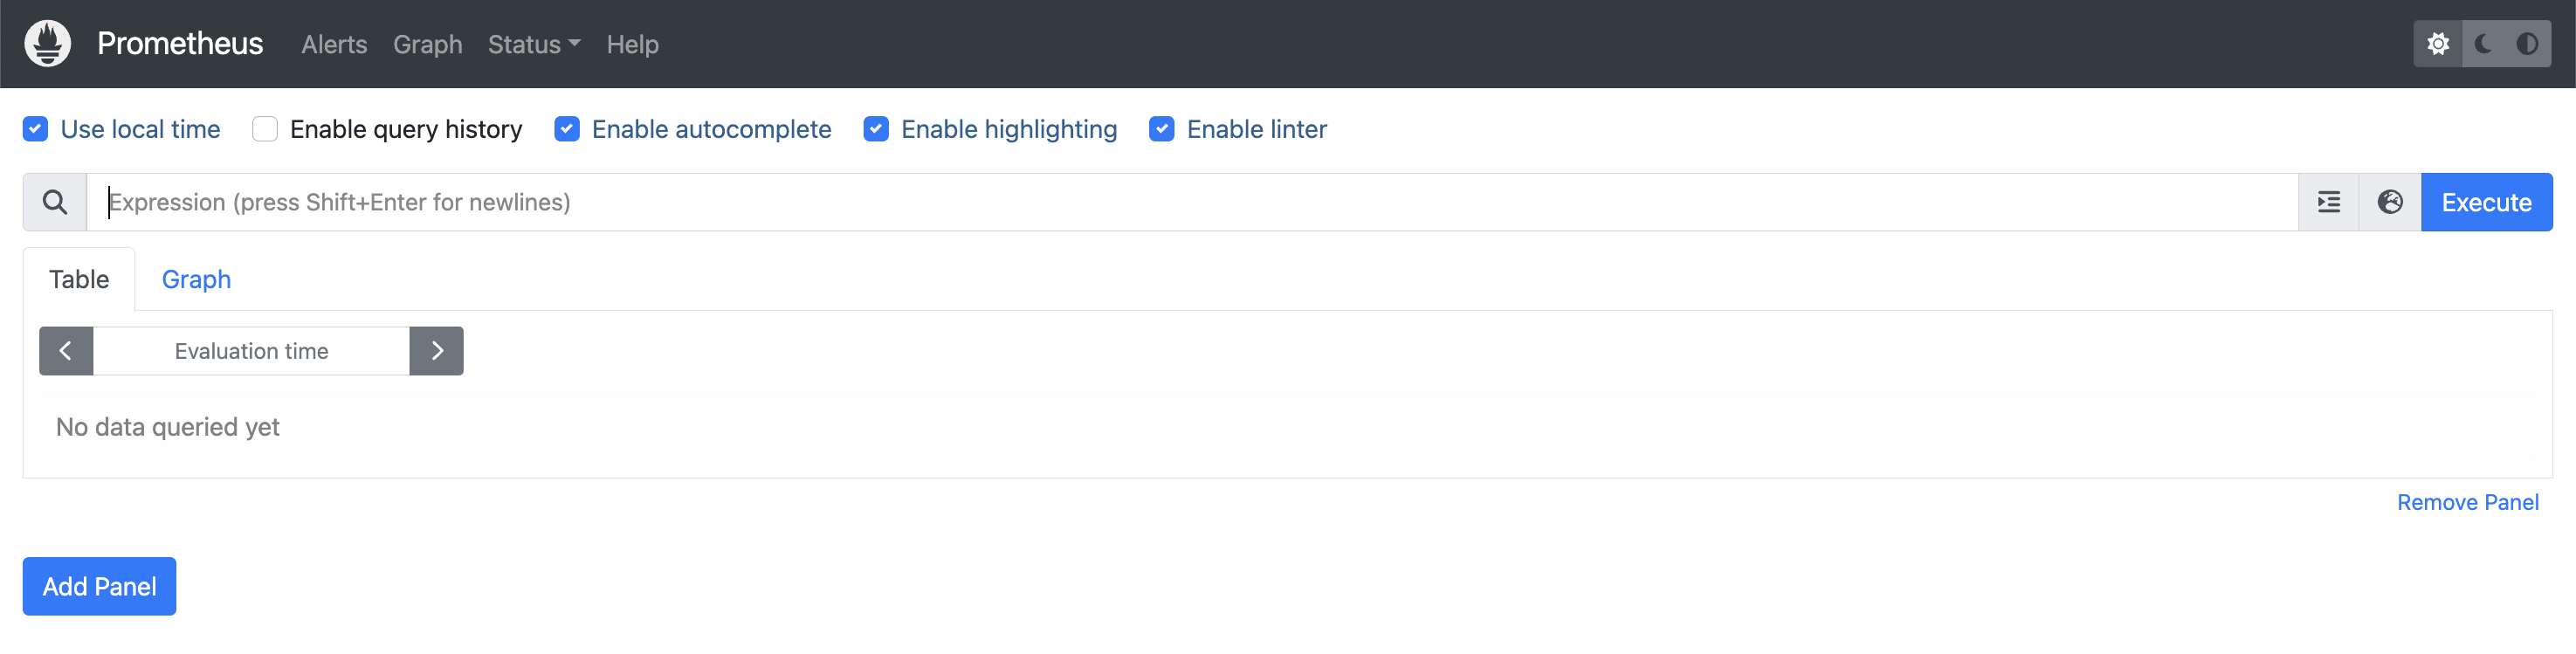
Unless you see any errors in the console output, you should now have a Prometheus server running at https://localhost:9090/. Open it up in a browser window, and you should see something like this:
Now go back to your terminal window and hit Ctrl+C to kill the running container, then we’ll start it again, but this time using a -d / –detach to background it and free up our terminal:
|
1 |
docker run —detach —rm —publish 9090:9090 prom/prometheus |
On success, Docker will print out the Container ID, and you can also find it with docker ps. As you’ll need it for some of the later steps anyway, let’s filter (with -f / –filter) the output of docker ps to show just the container ID that we want, based on the network ports that we’re using (in this case we’re publishing port 9090):
|
1 |
docker ps —filter publish=9090 |
We can add a -q / –quiet to only output the Container ID, and use the result in another command. For example, to view the logs of the Prometheus container you just started:
|
1 |
docker logs $(docker ps —quiet —filter publish=9090) |
That command will output something similar to when you started the Prometheus server the first time, when the container was still attached to the terminal. You can use the same technique with (for example) docker exec (if you want to start a shell in a running container), or docker kill (to send a signal to the container).
Let’s take a deeper look at the Prometheus server you have running on https://localhost:9090/. If you navigate to Status -> Targets, you can see that there is already a job running:
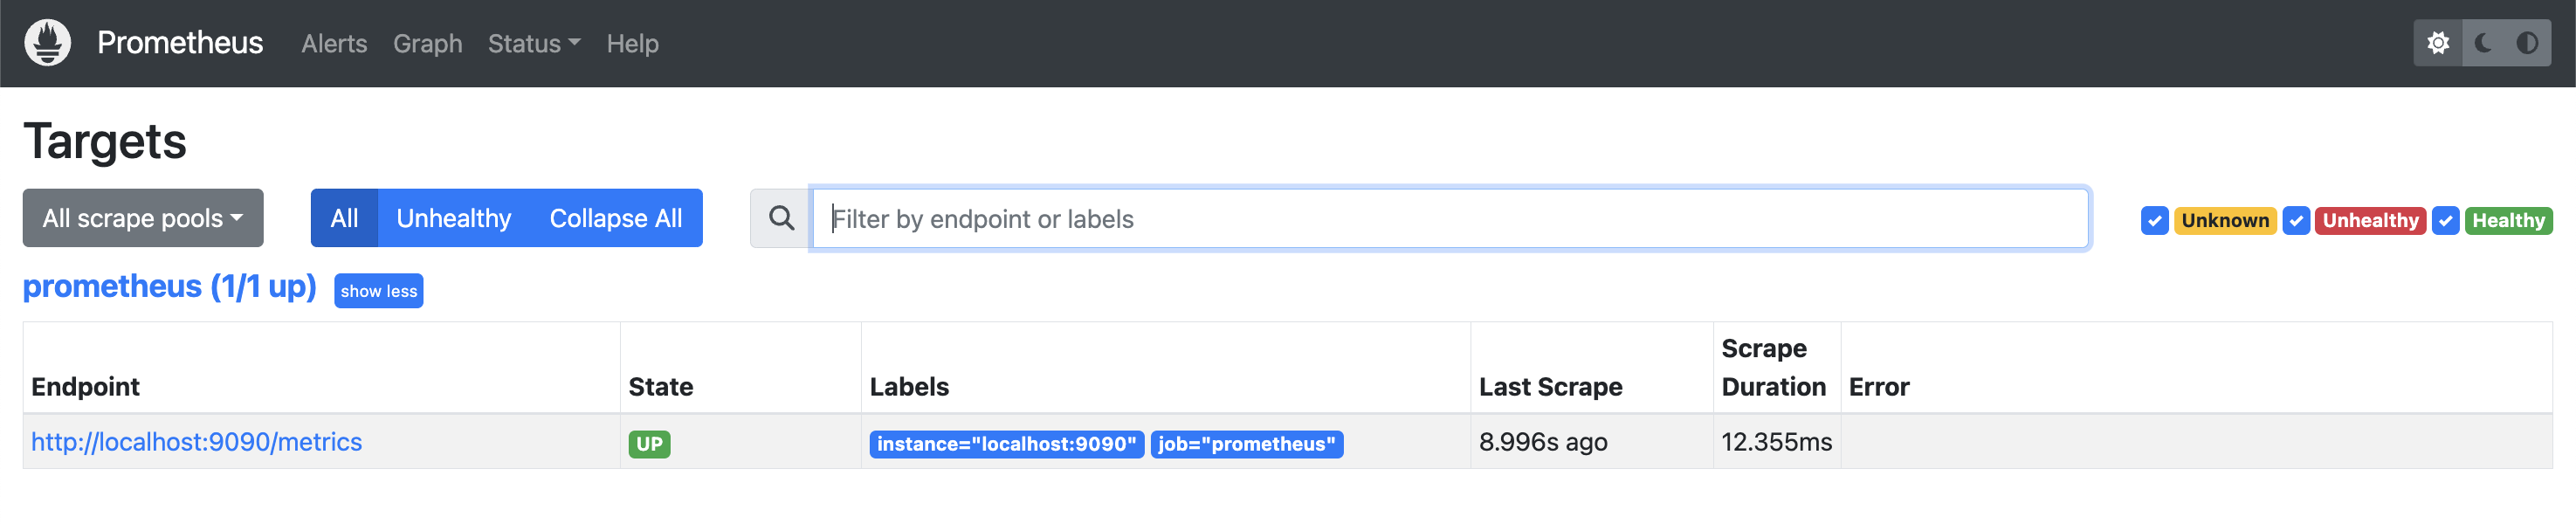
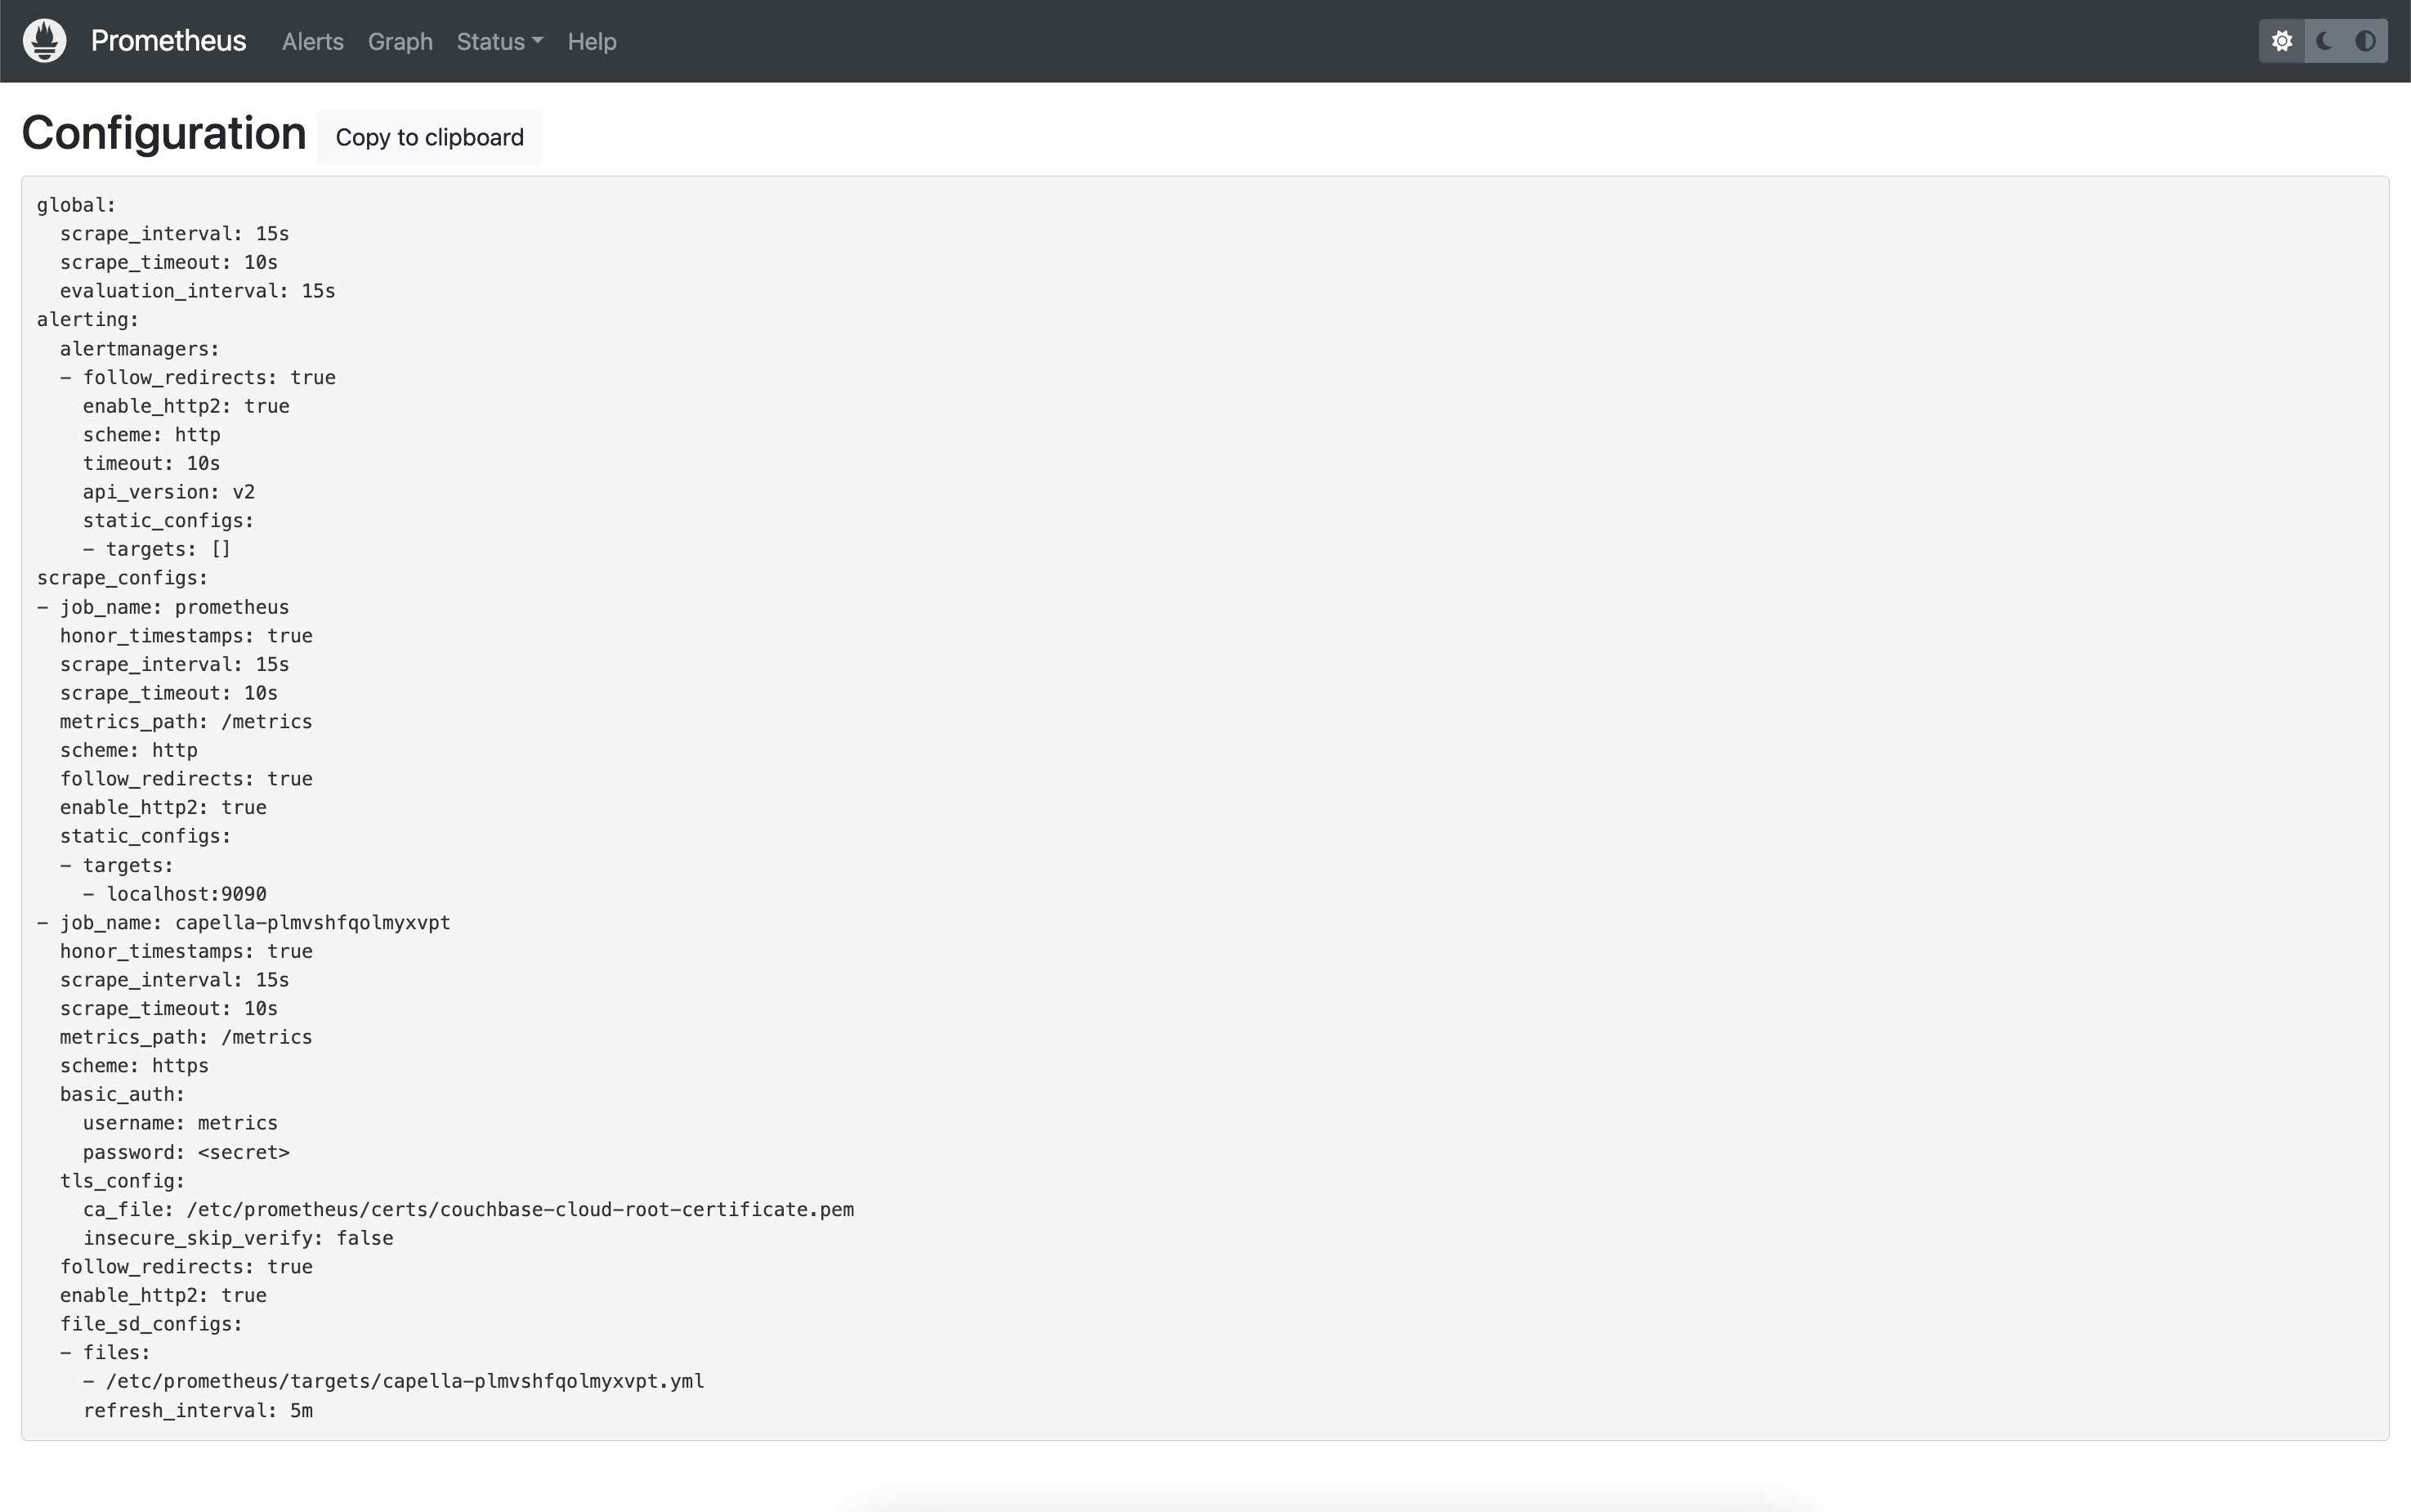
This Prometheus server has been configured to scrape itself as a target, which you can confirm by viewing its configuration (Status -> Configuration):
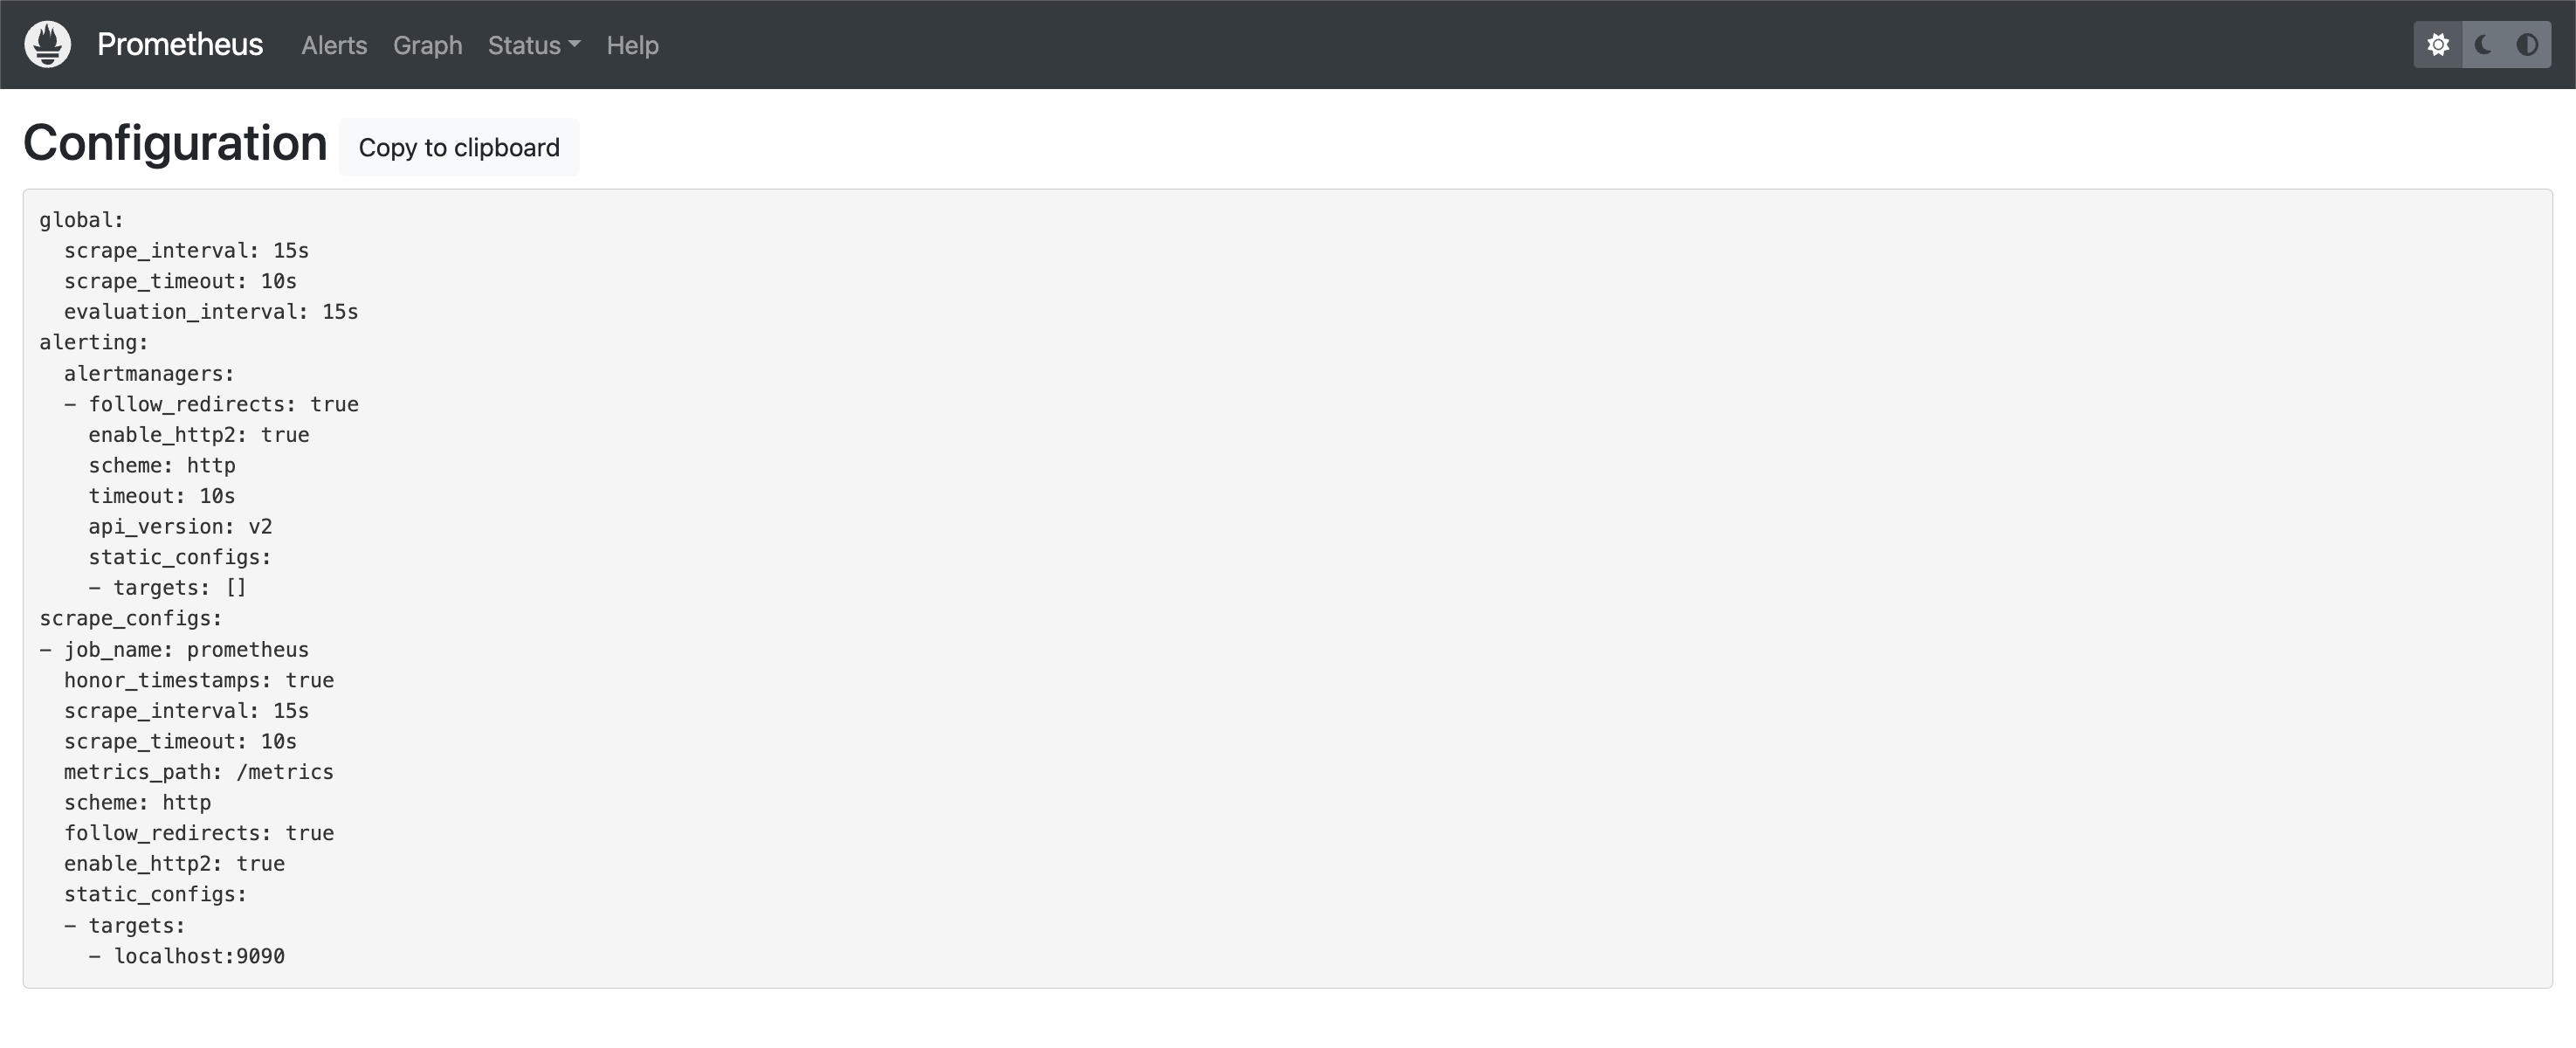
You can see in the above that there is a job named prometheus, which is targeting localhost:9090/metrics (targets + metrics_path). See Configuring Prometheus to monitor itself for a sample configuration.
Before we go back to our terminal, let’s take a quick look at metrics being scraped in the above job. If you click on Graph, you’ll find the Expression Browser, which allows you to enter PromQL expressions (see Querying Prometheus for an overview), and view the results.
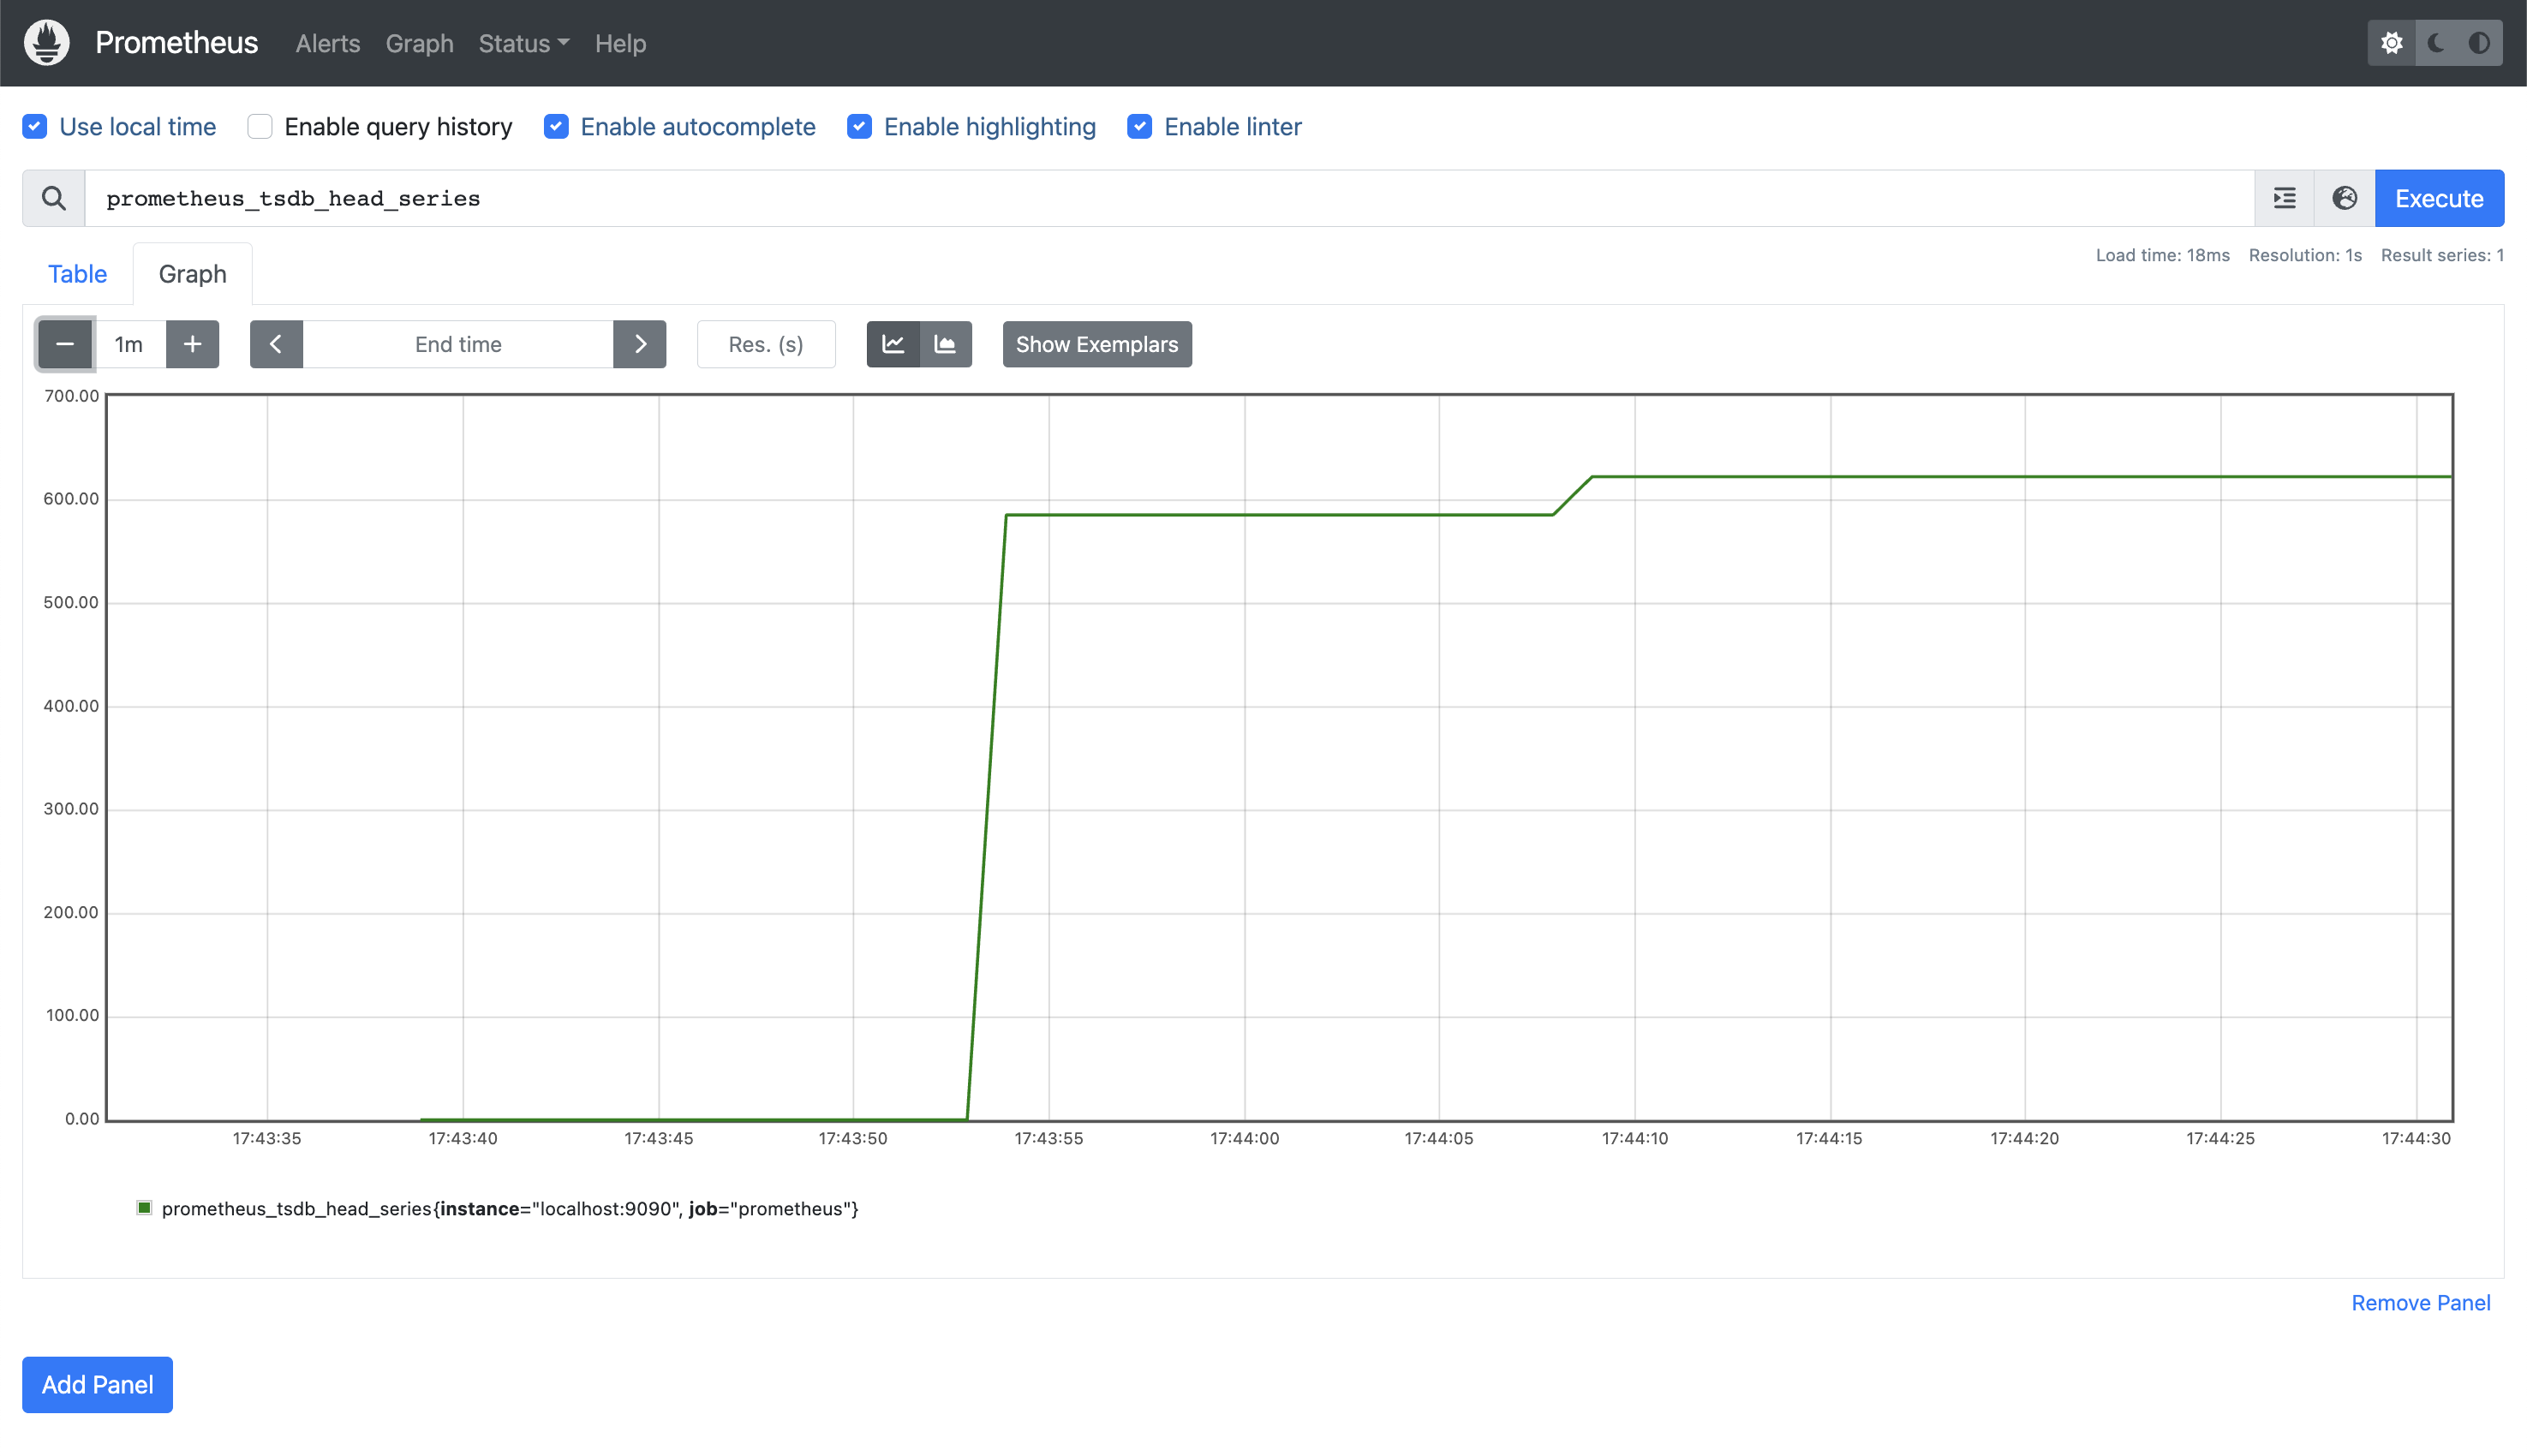
Note the Expression Browser is only meant for adhoc usage – the recommendation is to use Grafana as a fully-fledged graphing solution, and we’ll look at that in a future post. In the meantime, as a quick example, this is the number of time series currently stored in its own database (prometheus_tsdb_head_series):
If we want to add our Capella Database as a Scrape Job in our Prometheus server, this means we need to make changes to the configuration we saw above, but the configuration is baked into our container image. Once we have a final configuration we can rebuild the image, but for now it would be much more convenient if we could apply new configuration options and test without going to that much effort.
Let’s make use of Docker’s -v / –volume option, which allows you to mount a local file or directory in the container. The Prometheus configuration file in the container is /etc/prometheus/prometheus.yml – if that was the only file we needed then we could simply mount the file directly, but we’ll need a few more than that so we’ll mount a directory instead.
In your working directory, create a sub-directory that we’ll use to keep our configuration (prometheus.yml) and other associated files.
|
1 |
mkdir prometheus |
Now we need a copy of the configuration file that we can work with. As always, there’s more than one way to do this, but by far the simplest is to use the docker cp command, to copy /etc/prometheus/prometheus.yml from your running container, out to a local file:
|
1 |
docker cp $(docker ps —quiet —filter publish=9090):/etc/prometheus/prometheus.yml prometheus/ |
Now kill your currently-running container:
|
1 |
docker kill $(docker ps —quiet —filter publish=9090) |
And then start a new container, this time mounting your local prometheus directory as /etc/prometheus/ in the container:
|
1 |
docker run —detach —rm —publish 9090:9090 —volume $(pwd)/prometheus/:/etc/prometheus/ prom/prometheus |
If, like the author, you find yourself wondering how to tell if the Prometheus server is really using your copy of prometheus.yml or not, you can check the mounts inside the container to make sure that /etc/prometheus/ is specifically mounted with:
|
1 |
docker exec $(docker ps —quiet —filter publish=9090) mount | grep ‘/etc/prometheus’ |
You could also make a small change to the configuration (for example, the name of the existing scrape job), and this should be reflected in the console (at https://localhost:9090/config).
Lastly for this section, as we’ll be making a few changes to our configuration file, it would be good if we didn’t have to recreate the container to apply the changes. Prometheus does have a built-in API method for this, discussed in Configuration, but the –web.enable-lifecycle option is not enabled by default in the official container. Fortunately (for MacOS and Linux users at least), there is the option to send a SIGHUP with docker kill (resulting in a “Loading configuration file” message in the logs):
|
1 |
docker kill —signal SIGHUP $(docker ps —quiet —filter publish=9090) |
In summary so far then, we now have a running Prometheus server, we know how to check its logs, browse the metrics that it is scraping, and how to update and reload its configuration, making it easy for us to add in our Capella Database as a scrape target.
Adding a Capella Database to your Prometheus Server
Now we have a Prometheus server, let’s take a look at adding a Couchbase Capella database.
Prerequisites
For each database that you want to collect metrics from, you’re going to need:
- The Connection Hostname
- User Credentials with the appropriate Database Access
- A Security Certificate
- One or more Allowed IP Addresses
Connection Hostname
This is the hostname from your Connection String. Go to the Connect tab on your Database in the Capella UI and copy everything after the couchbases:// scheme prefix. The one we’re using in our examples is: cb.plmvshfqolmyxvpt.cloud.couchbase.com.
User Credentials
A set of credentials (username/password) that has Read Access to All Buckets and All Scopes in your Database (as noted, the required external_stats_reader role is only granted when a Database Credential is given Read Access to all Buckets in a Database). If you don’t have one, you can create one from Settings -> Database Access -> Create Database Access (see Configure Database Credentials). In our examples, we’ll use metrics_user / metrics_Passw0rd.
Security Certificate
The Security Certificate for your Database. From your Database, go to Settings -> Security Certificate, and click on Download. This will give you a PEM-formatted text file named after your cluster (in our case bravetimbernerslee-root-certificate.txt). Actually, the same signing certificate is used for all Capella Databases, so you only need to download it once, and can use the same Root Certificate to verify all your Capella Databases. To that end, we’ve renamed our local certificate file to couchbase-cloud-root-certificate.pem for clarity, and copied into our prometheus directory (in a subdirectory named certs) so that Prometheus can access it later.
Allowed IP Addresses
Before any client can connect to a Capella Database, the client’s IP address must be added to the Database’s Allowed IP list. For the purposes of following the steps here you most likely want to add your current IP address, in which case you can use the Add My IP button. For a production deployment you will need the public-facing IP address of your Prometheus server(s).
Defining a new Scrape Config
Let’s start by taking a look at the existing job, that tells Prometheus to scrape from itself.
If we ignore the global settings and defaults, it becomes the following:
0
If you look at the documentation for scrape_config you can see that this is essentially the smallest possible definition of a job. There’s no TLS, no authentication, just a name and a single target (which with the defaults added becomes https://localhost:9090/metrics).
As an aside, you can test this out if you’re interested by loading up that URL in your browser, or by using curl on the CLI. The resulting output is in Prometheus’ text-based Exposition Format.
Our new job will need a name – this needs to be unique across all scrape definitions, which is worth bearing in mind if you’re planning on adding multiple Capella Databases. For our example we’ll use the unique component of our Connection Hostname to differentiate, giving us:
1
We know that we’ll need to authenticate to access the metrics endpoint, using the credentials above:
2
All Capella communication is encrypted with TLS, so we’ll need to add a tls_config parameter using the certificate we downloaded earlier:
3
And relatedly, scheme defaults to http, so we’ll need:
4
The last thing we need to do is tell Prometheus the hostname(s)/address(es) to use to connect to your Database, otherwise known as targets.
In the prometheus job above, a single hostname is provided using the static_config parameter. As the name suggests, this is a way to statically define one or more targets, and these will not be updated or refreshed unless the Prometheus server is restarted, or its configuration file is reloaded.
This is fine in this case, as the hostname (localhost) is never going to change. It might also be manageable if you have hostnames that change occasionally, and are only updated under controlled circumstances (for example a scheduled maintenance period where you can update your Prometheus configuration at the same time).
But what if your hostnames do change frequently, and the timing of those changes is out of your control? If the application you are monitoring is hosted in any kind of cloud environment, where there is on-demand scaling, server replacement on failure, automated upgrades, then you’ll need a much more flexible method of specifying your targets.
This is where Service Discovery comes in.
Service Discovery
Prometheus Service Discovery (SD) is a mechanism that allows your Prometheus server to dynamically discover (and update) the list of targets to monitor for a particular application or service. At time of writing there are 28 different mechanisms, including generic options such as File- and HTTP-based Service Discovery, as well specific implementations for a large number of cloud platforms and applications (see the Prometheus configuration documentation for the full list).
Let’s look at those two generic options in relation to your Couchbase Capella Database.
File-based Service Discovery (file_sd_configs) is where one or more filenames are provided to Prometheus, each file containing zero or more static_config entries. Prometheus will apply any well-formed targets it finds in those files, and will automatically load any changes when the files are updated.
This mechanism is useful in that you can use it to connect to any arbitrary system, as long as you can get the host details into a correctly-formatted file (either manually or by any appropriate automation). However, you do need to make sure that the automation to update the file(s) is reliable.
HTTP-based Service Discovery (http_sd_configs) is similar to File-based, in that it provides a generic interface, with a payload containing zero or more static_config entries, but uses an HTTP connection to fetch the payload rather than reading a local file. This removes the dependency on any automation or human intervention, and as long as your target application provides the relevant API, would be preferred over the File-based option.
At time of writing, we are in the process of upgrading the Capella estate from Couchbase Server 7.1 to 7.2 (see Upgrading a Database for more details). Server 7.1 only provides a basic File-based Service Discovery API, but in Server 7.2 we have added HTTP-based SD, as well as improved File-based SD.
We’ll look first at the File-based Service Discovery method in Server 7.1. Feel free to skip ahead one section if you’re already running Server 7.2.
File-based Service Discovery in Couchbase Server 7.1
The endpoint is prometheus_sd_config.yaml, you’ll need to authenticate with the same credentials as above, and provide the Capella Root Certificate we downloaded earlier.
First, we’ll just use curl and stream the result to our terminal:
5
For our cluster this gives:
6
Here we can see the limitation of the current Service Discovery API – it will always return the insecure port (8091), which is no use to us in Capella as all communication is over the secure port (18091). This issue is fixed with the improvements in Server 7.2, but until those are available we need to add an extra step to update those port numbers.
For the sake of this demo we’ll just pipe through sed, but you can do whatever is most appropriate for your environment:
7
For our cluster this now gives:
8
Now we have the correct output, we can redirect it to a file to use later in our job definition.
In our working directory, we’ll use a subdirectory to keep our targets together, naming the files after the job name (in our case capella-plmvshfqolmyxvpt):
9
This is fine for our demo, but obviously you’ll want to make sure it’s robust and suitable for your own environment, adding error handling as appropriate. And crucially, you’ll need to schedule this to be run regularly to make sure that the list of targets is updated with any topology changes as they happen (running once per minute via cron for example, would be sufficient).
We can now take everything we have above, add in our file_sd_configs, and our new job looks like this:
0
HTTP-based Service Discovery in Couchbase Server 7.2
In Server 7.2 we’ve added a new endpoint (prometheus_sd_config), and similar to above you’ll need to authenticate with the credentials that you created, and provide the Capella Root Certificate we downloaded earlier.
First, we’ll use curl and stream the result to our terminal. In the new API the default output is JSON, so we’re piping to jq for clarity:
1
For our upgraded cluster (where the hostnames have changed during the upgrade process), this gives:
2
This output is exactly what Prometheus is expecting, so we can take the arguments we used in the curl command and use them in an http_sd_configs scrape configuration in our new Prometheus job:
3
Running your new Job
At this point you should have all you need to add the new scrape job to your Prometheus server. If you’re still using Couchbase Server 7.1 then it’ll be the file_sd_configs based one (with whatever steps you need to create the targets file), and if you’re running Server 7.2 then the http_sd_configs based version.
Add the new job to your prometheus.yml, then reload the configuration with the kill command we used earlier:
4
You can then check the logs to make sure that the configuration loaded cleanly:
5
Remember you’re looking for a Loading configuration file log message, and as long as your config is valid, you should see a Completed loading of configuration file message immediately after. If you don’t have a successful reload, then you need to address any issues and try again. Once you do, let’s go back over and look at the Prometheus console at https://localhost:9090/.
First let’s look at our new configuration (Status -> Configuration), which should show the extra job we just added.
This is the full configuration using File-based Service Discovery:
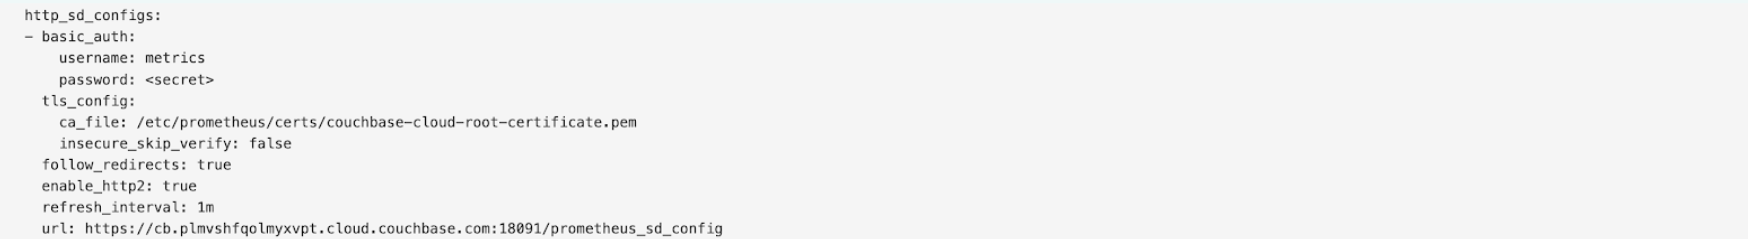
And here’s a snippet showing the HTTP-based scrape instead:
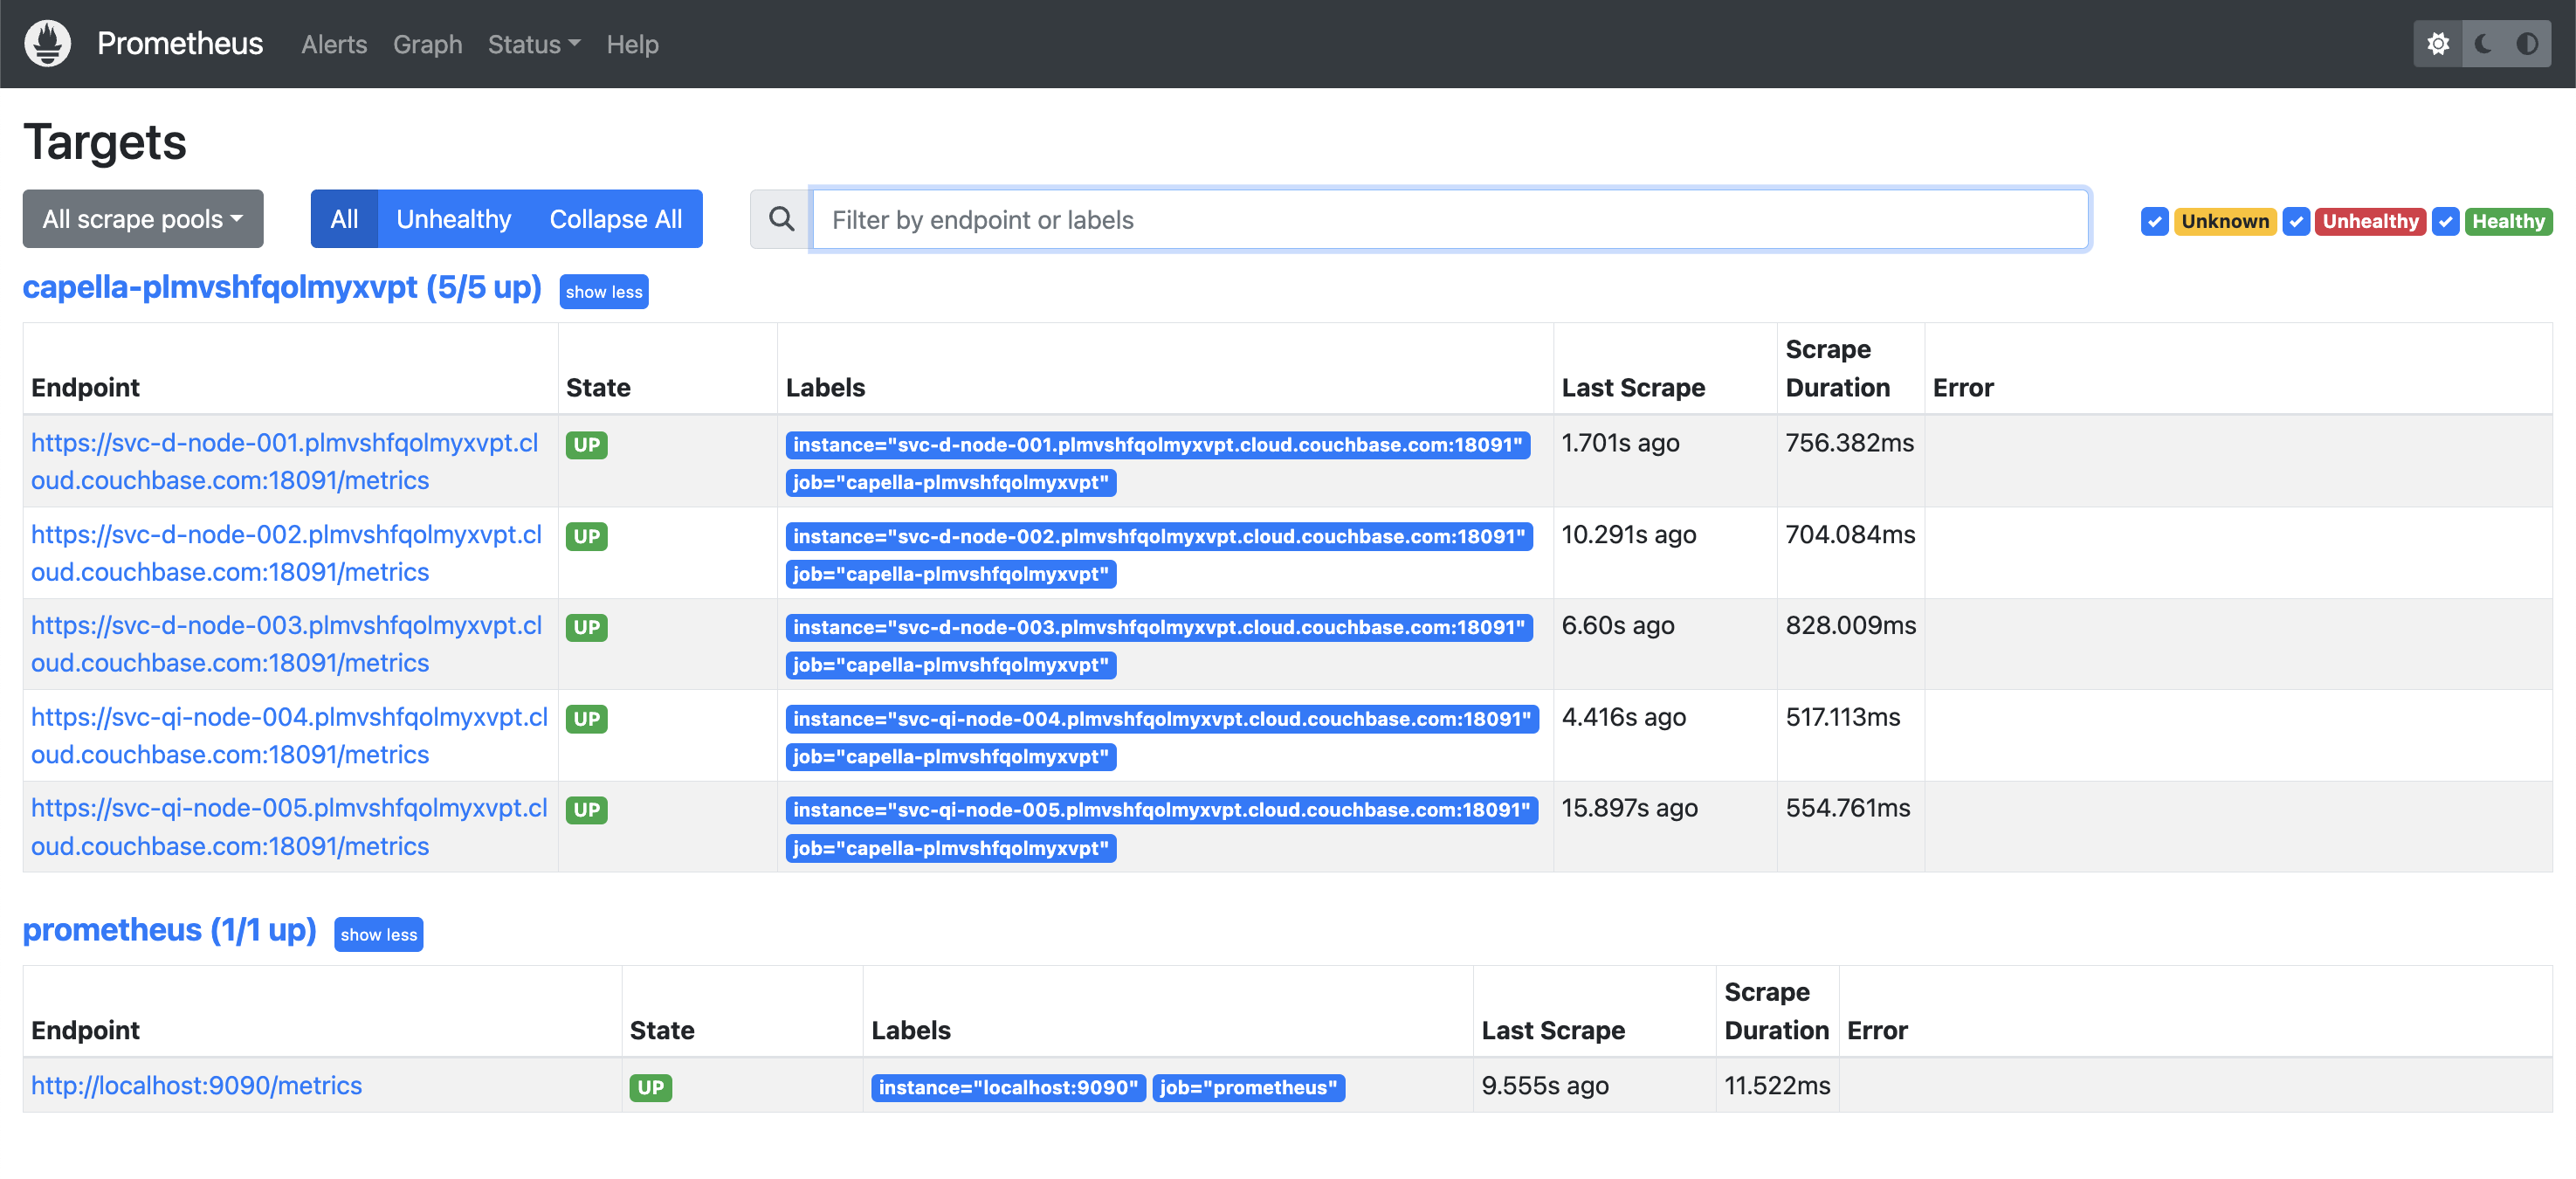
Now, if we look at Status -> Targets, it should show all the nodes from your Capella Database. For example, this is our cluster before the upgrade to Server 7.2:
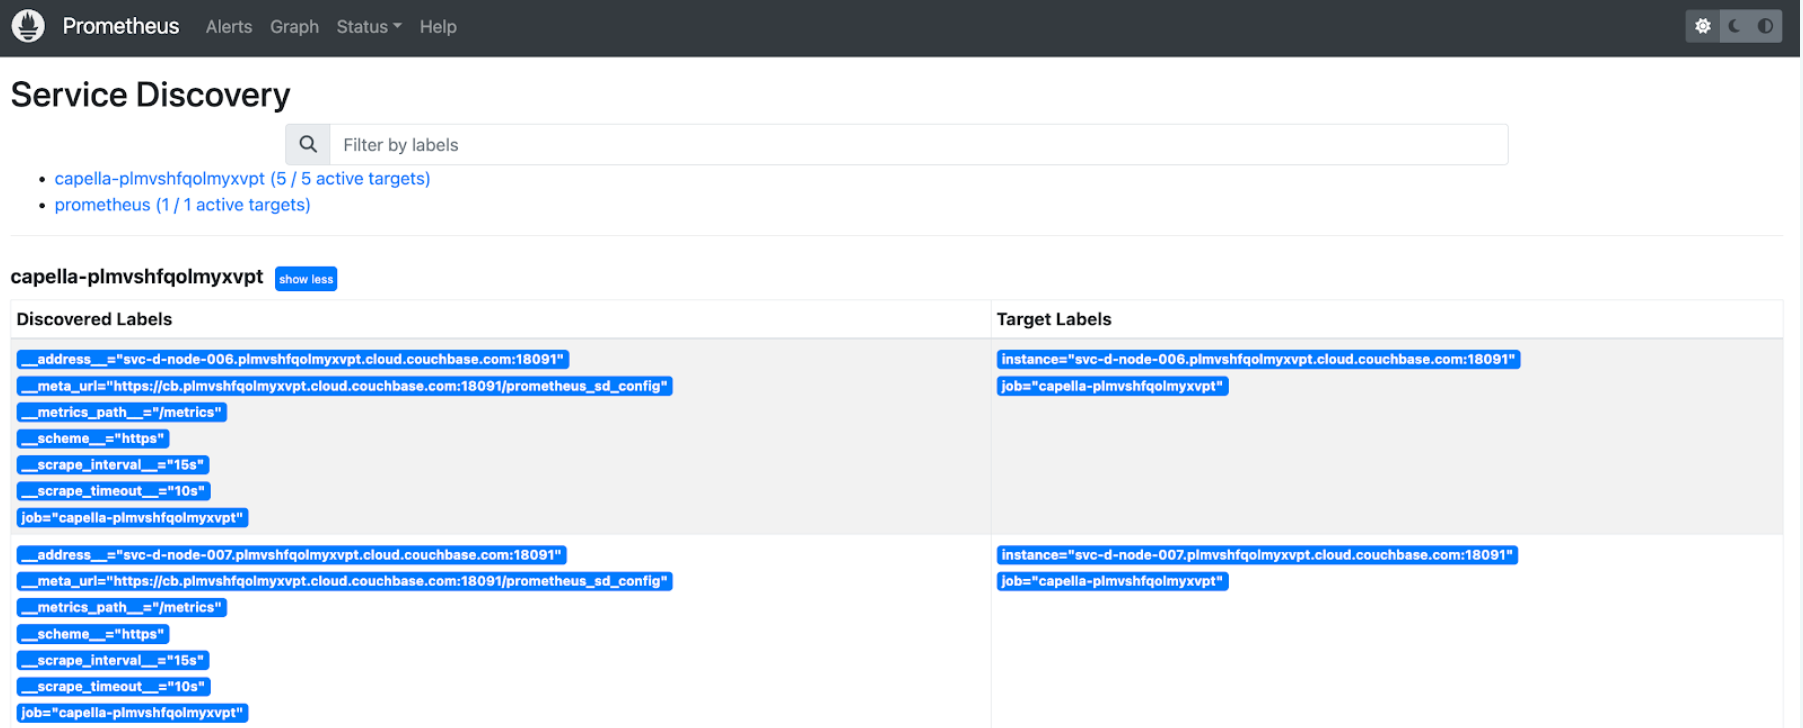
Relatedly, if the Targets aren’t what you expected, Status -> Service Discovery will show you where each endpoint comes from. Here’s the Service Discovery status for our upgraded cluster, where we’re using HTTP SD (snipped to show just the first few nodes):
Now that we’ve added our Capella Database, how do we check that we’re actually getting anything useful?
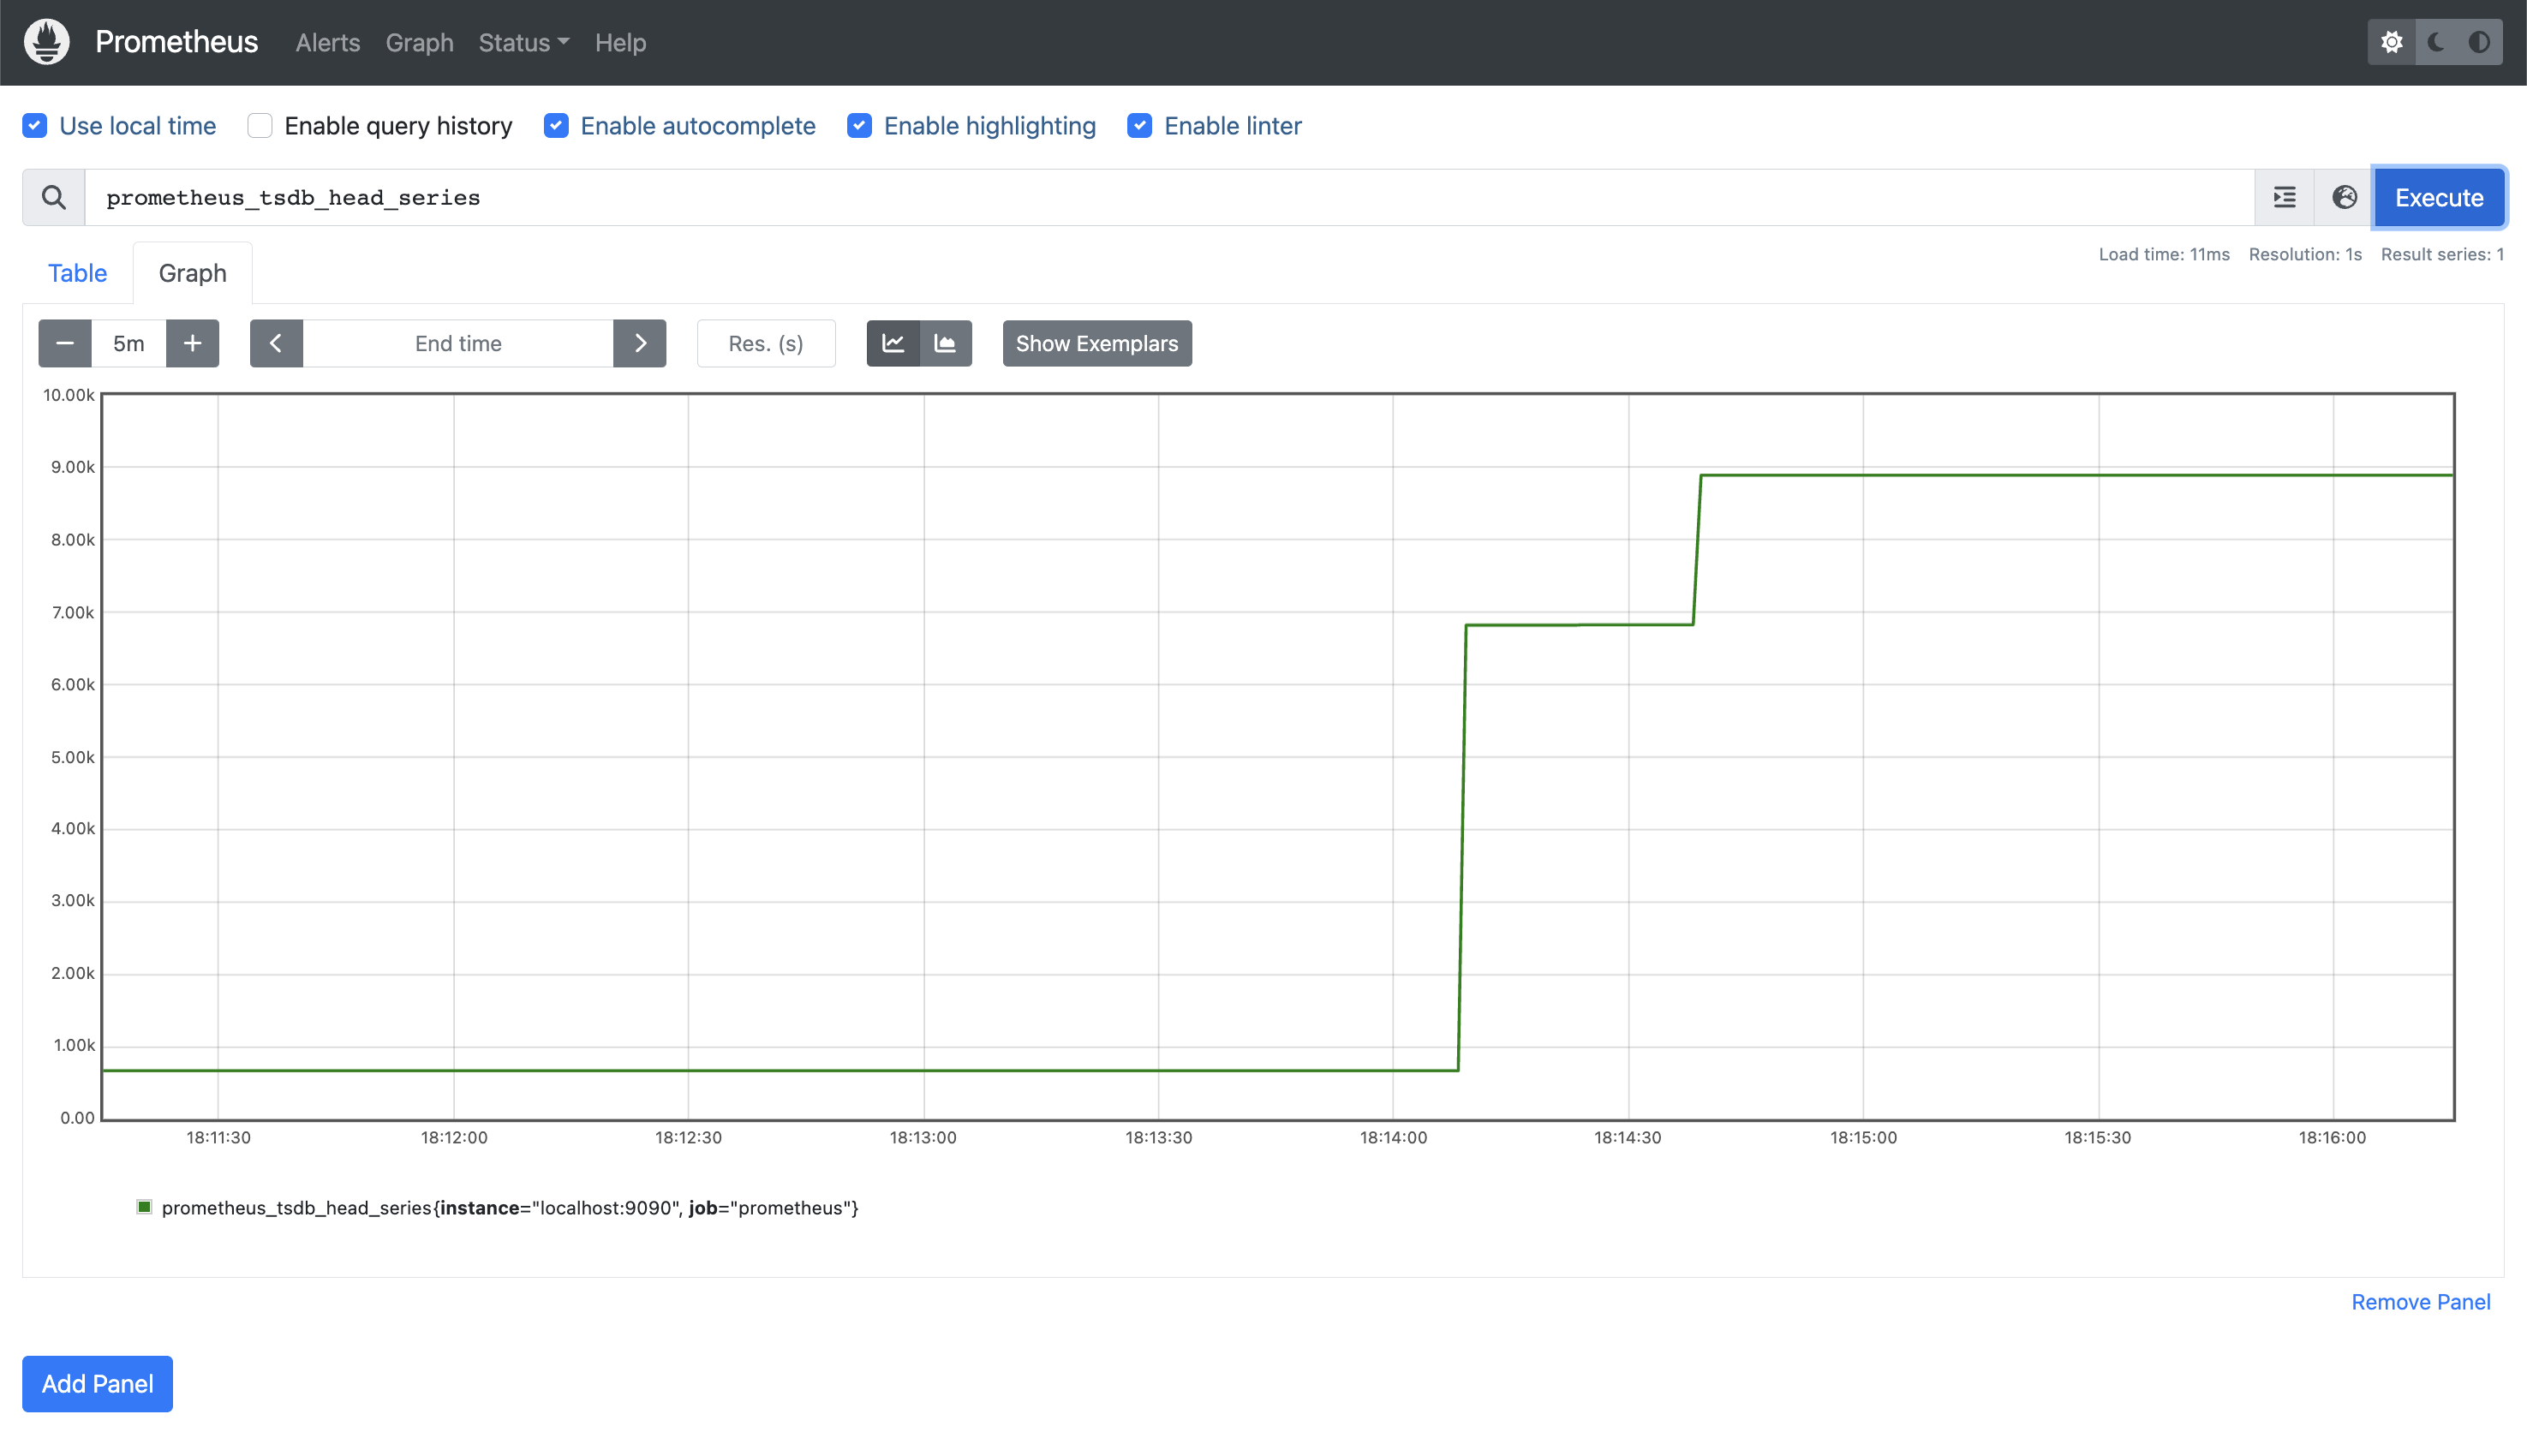
First, if we revisit the graph from earlier, we can see that the number of time series being stored (prometheus_tsdb_head_series) has grown considerably:
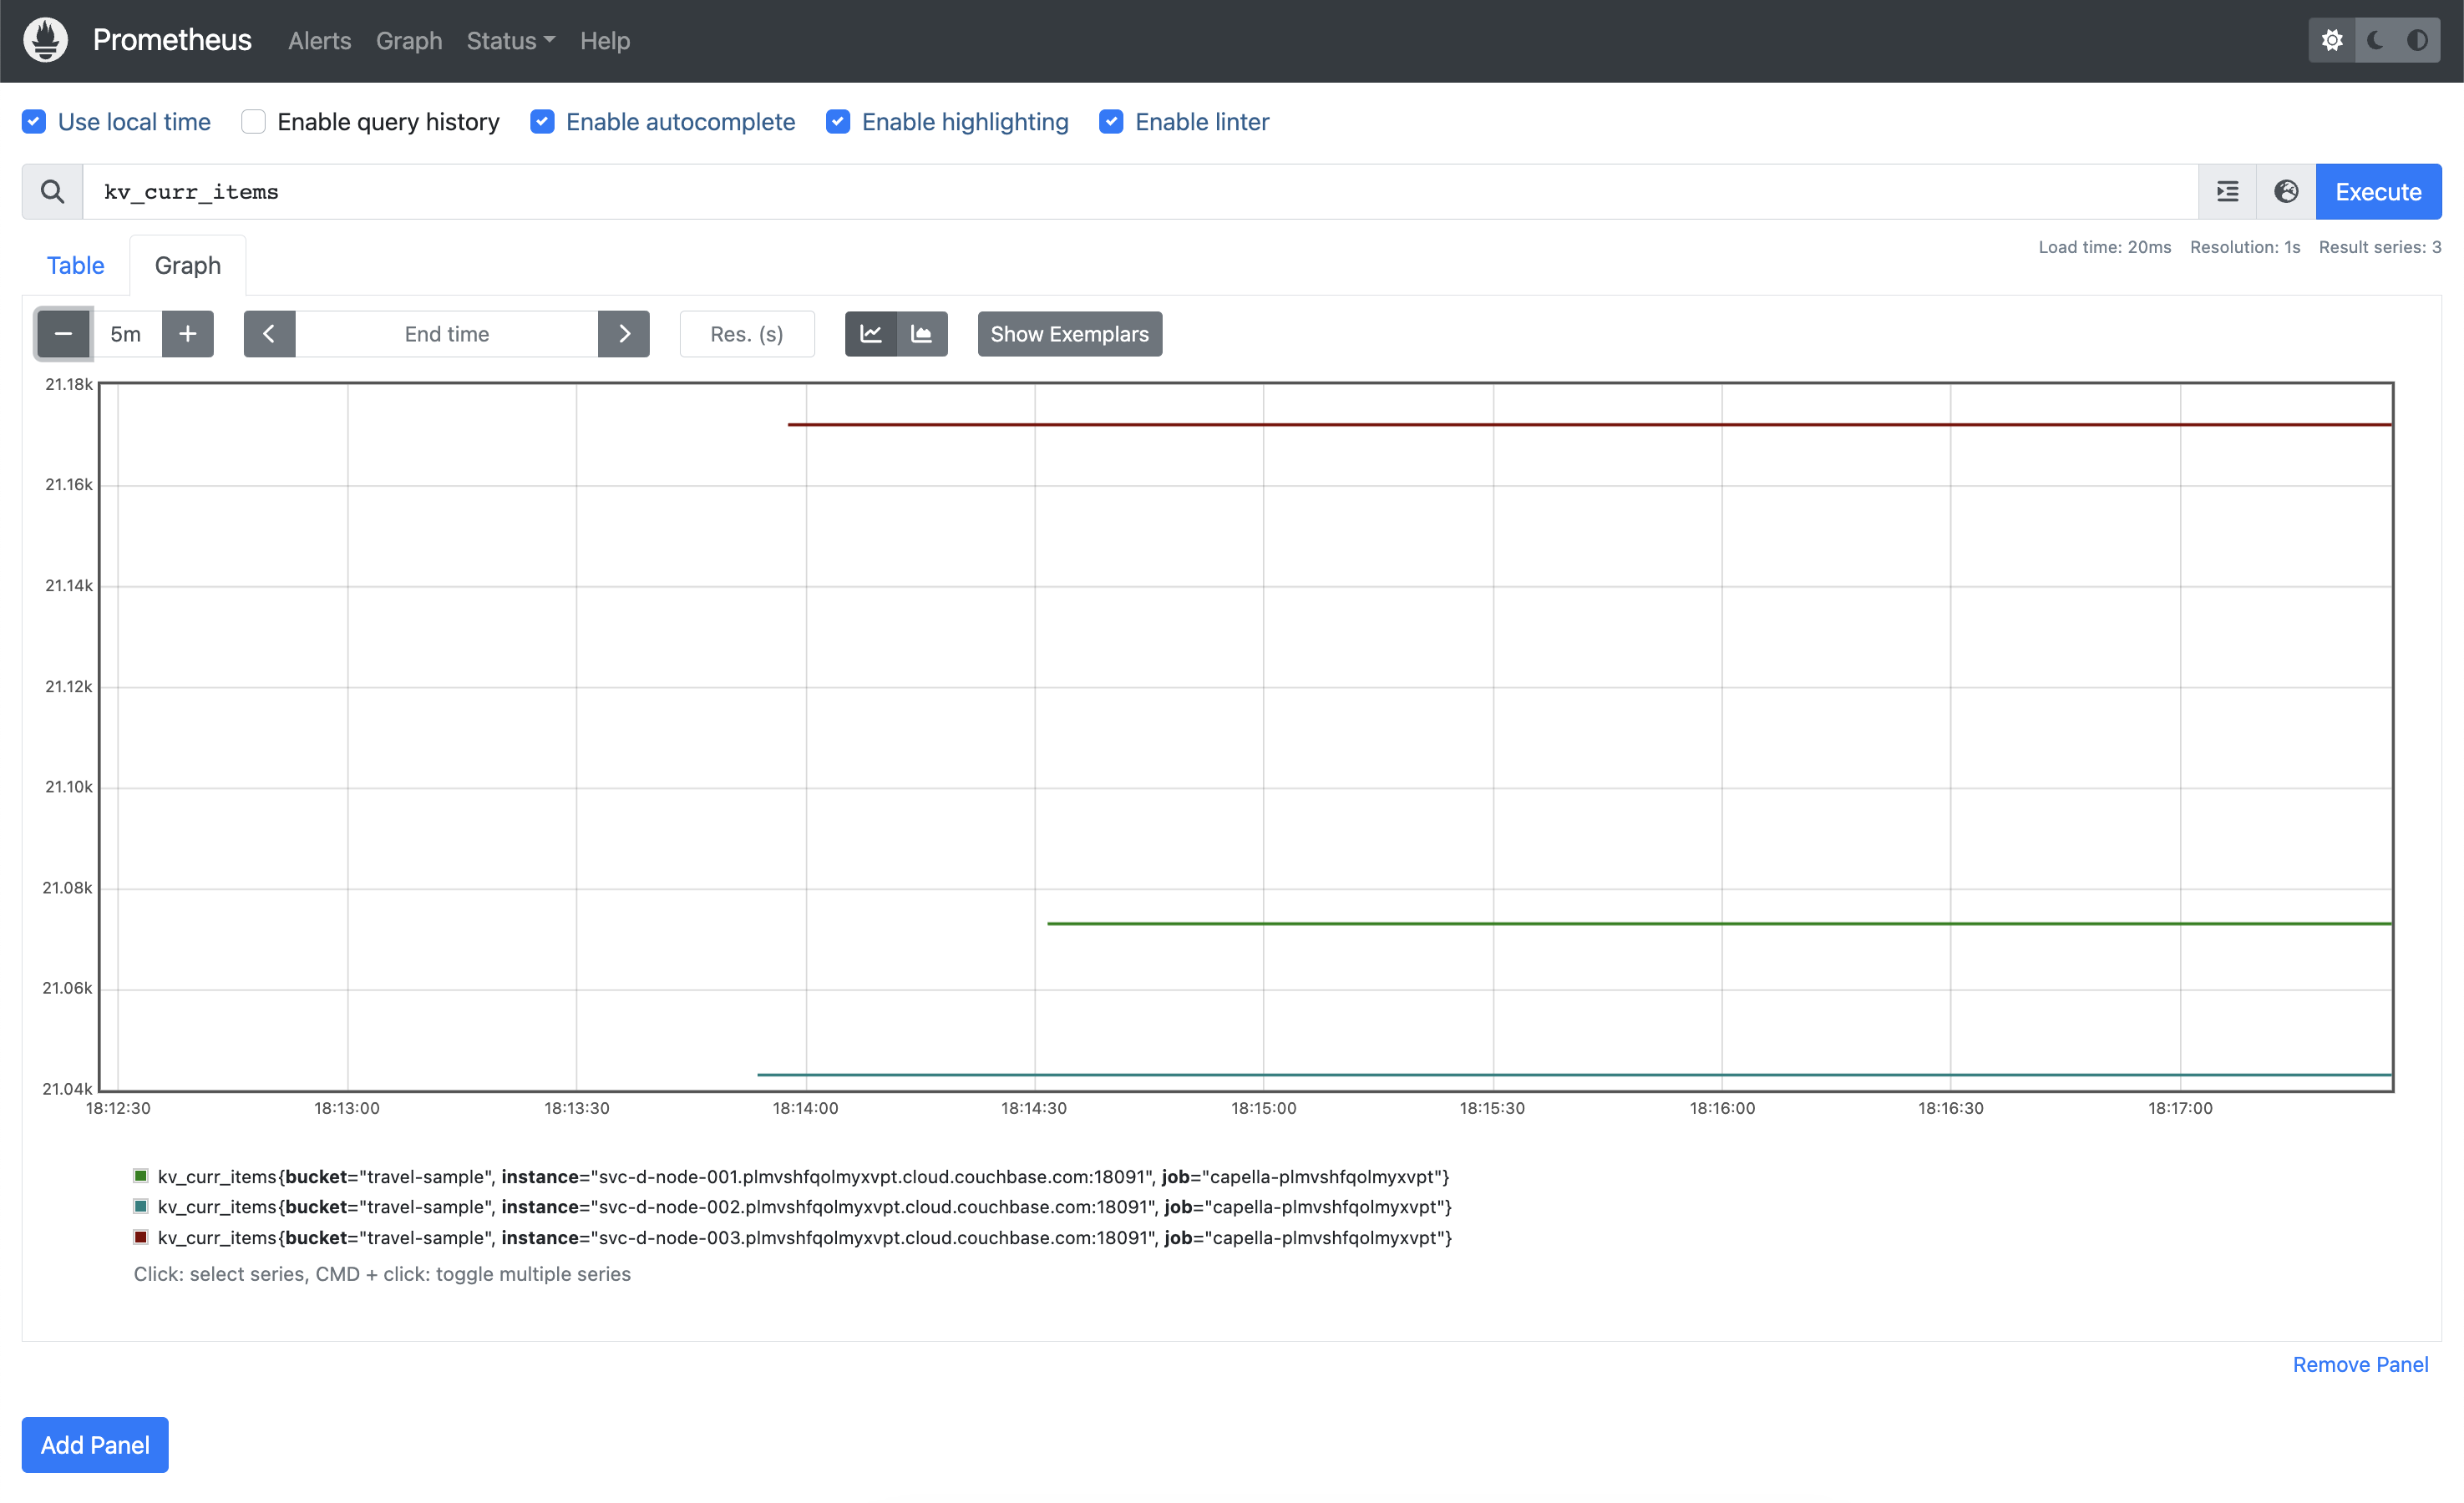
Then we can confirm that we do indeed have some Couchbase Server metrics captured. We have the travel-sample dataset loaded in our database, which contains just over 63,000 items. If we query kv_curr_items we can see that each of our three Data Service nodes have ~21,000 items each:
Conclusion
In this article we’ve shown you how to run a simple Prometheus server in your local development environment, and how you can add your Couchbase Capella Database so that you can begin to monitor it. In the following posts in this series, we’ll show you what you can do with those metrics now that you have them.
As always, we appreciate any and all feedback, please feel free to reach out by leaving a comment here, or you can find us on our Forums, or our Discord.
Author
2 Comments
-
cb.plmvshfqolmyxvpt.cloud.couchbase.com is not reachable when we use VPC peering with Capella
Anyway to do service discovery in VPC peering ?
-
The host mentioned in connect page is not reachable when we use Capella with VPC peering.
Anyway to do service discovery with capella in VPC?
Leave a comment
You must be logged in to post a comment.