Category: Monitoring
Testing Couchbase with GitHub Actions and CBSH
Automate Couchbase connection tests in GitHub Actions using environment variables, secrets and Couchbase Shell, including set up steps.

High Availability Architecture: Requirements & Best Practices
High availability architecture is a design approach that ensures systems are operational and accessible with minimal downtime. Learn more about it here.

Announcing Audit Logging for Capella App Services and HIPAA Readiness
Capella App Services now supports Audit Logging - detailed, trackable records of key events to improve security, compliance, and observability. HIPAA-ready!

Capella App Services: Real-time Log Streaming to Sumo Logic
In an earlier post, we discussed the fundamentals of Log Streaming on Capella App Services. App Services logs can be streamed in real-time to third-party observability platforms such as Datadog or collectors, hosted in customer premises. Log Streaming allows you...
What is Cloud Monitoring? Types, Best Practices, Tools
Learn all about cloud monitoring, including types, benefits, best practices, and the tools and services available.
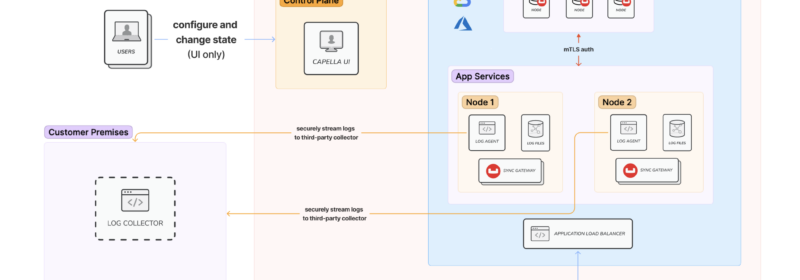
Capella App Services: Enhancing Observability with Real-Time Log Streaming Support
Log Streaming in Capella App Services, starting with its benefits and use cases, followed by tutorials on implementing Real-Time Log Streaming from App Services to observability platforms such as Datadog and SumoLogic.

Capella Management: More Flexible and Affordable
Capella removes a huge amount of setup and administrative efforts. We recently added two new features: downloadable backups and database on/off.
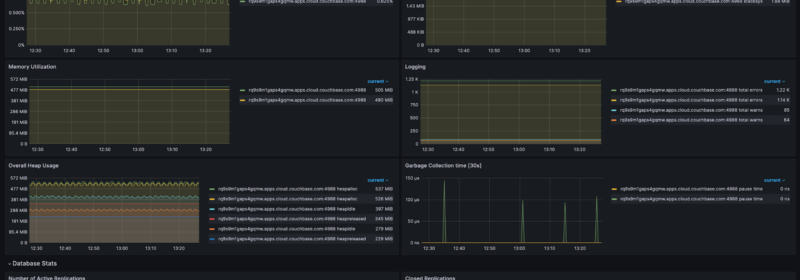
How to Monitor Capella App Services with Prometheus and Grafana
In this blog post, Couchbase explores how you can easily monitor Capella App Services using Prometheus metrics and Grafana to provide real-time insights.

Grafana Plugin For Couchbase Visualization Released
Grafana can now access Couchbase data sources using our new plugin. Read how to create custom queries, time-series views, and dashboards with Couchbase today.

Get Started with Couchbase Capella in a 3 Easy Steps
Dive into Couchbase Capella in this basic walkthrough that shows you how to sign up in seconds and have your cluster spun up in less than three minutes.
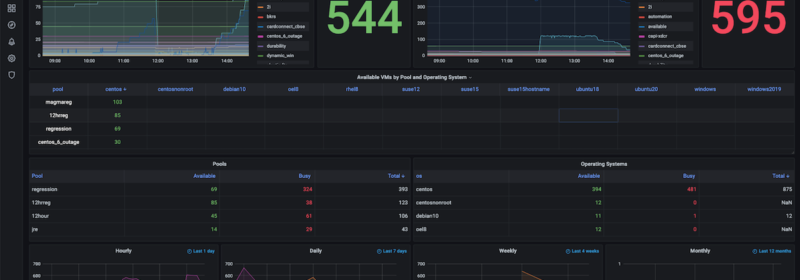
How to Build Observability Dashboards with Prometheus, Grafana & Couchbase
In this blog, we take you through the process you need to follow to build your own observability dashboard using Prometheus, Grafana and Couchbase.

How Vodafone Powers a 100% Cloud Communications Platform with Couchbase
Discover why Vodafone chose Couchbase to power their customer communications management tool and how Couchbase scaled to meet exponential user growth.
Top Posts
- Optimizing Multi-Agent AI Systems With Couchbase
- Data Modeling Explained: Conceptual, Physical, Logical
- Data Analysis Methods: Qualitative vs. Quantitative Techniques
- What are Embedding Models? An Overview
- What Is Data Analysis? Types, Methods, and Tools for Research
- What are Vector Embeddings?
- Application Development Life Cycle (Phases and Management Models)
- A Breakdown of Graph RAG vs. Vector RAG
- High Availability Architecture: Requirements & Best Practice...