
Capella App Services is a fully managed Backend-as-a-Service (BaaS), specifically tailored to mobile, IoT and edge applications. It empowers developers and organizations to seamlessly integrate with Couchbase Capella and synchronize data across various devices that use Couchbase Lite.
It combines the ease of a managed service with powerful observability tools for monitoring resource use, throughput, and errors, helping to swiftly identify and address performance and scalability issues.
Log Streaming
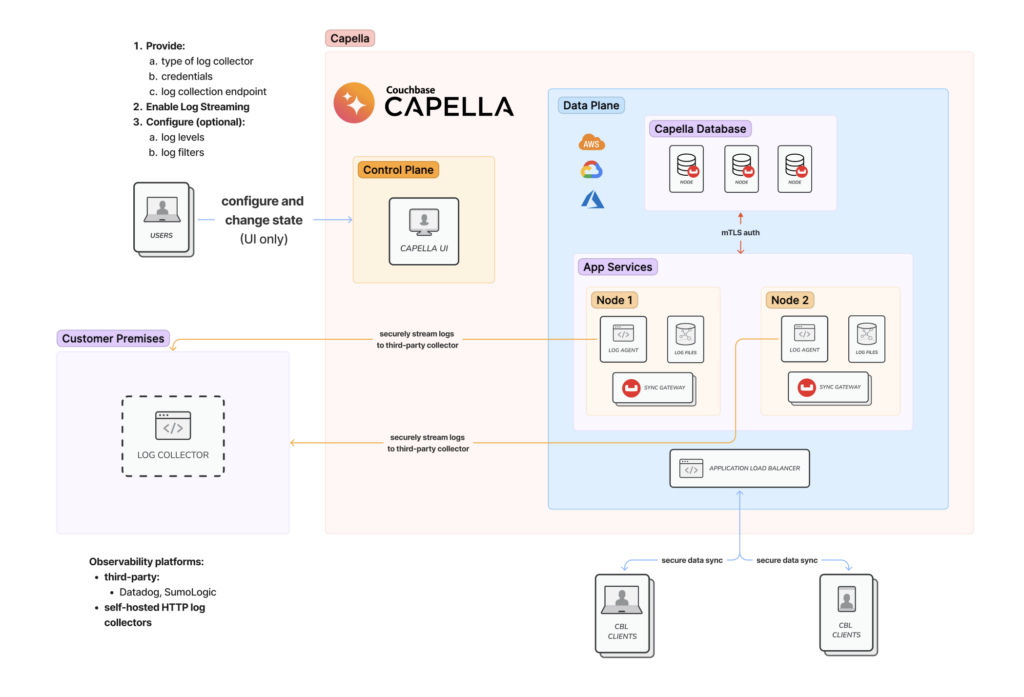
As of today, we are enhancing our observability offering with the introduction of Log Streaming: real-time streaming of Capella App Services operational logs to third-party observability platforms such as Datadog or SumoLogic or self-hosted HTTP logs collectors to enable log based monitoring, analysis and alerting.
Log Streaming allows you to gain instant insights into application behavior, enabling rapid issue detection and resolution to enhance application reliability, availability, and security.
As a managed, distributed service, Capella App Services is implemented by multiple nodes. In a self-hosted service, like Couchbase’s Sync Gateway, you can directly connect to a node to figure out the root cause and fix for issues with access control and data synchronization. With a managed service, however, access to a given node’s logging data is not exposed directly.
The Log Streaming feature is now generally available in Capella App Services 3.1.2 for customers on Dev Pro or Enterprise plans. Logs are not retained indefinitely and log streaming is resilient to temporary network disruptions.
Log streaming of console logs from a managed Backend-as-a-Service (BaaS) like Capella App Services to third-party or customer hosted observability platforms is particularly beneficial in the following use cases:
- Development and Testing Environments: Developers working on new applications can stream logs in real-time to aid in debugging, especially for intricate Access Control and Data Validation functions. This immediate feedback loop allows for rapid identification and resolution of issues.
Log Streaming also provides a granular view of the backend processes, offering developers the ability to track authentication processes, API calls, and database interactions as they happen.
- Mission-Critical Applications: For customers running applications where uptime and performance are essential, real-time log access is crucial. It enables them to maintain service level agreements (SLAs) with their clients by proactively managing and responding to incidents, ensuring high availability and reliability.
In these cases, the use of real-time logs allows for a more autonomous, efficient, and responsive approach to operational management, reducing the need for intervention from the Capella Support team and enhancing the ability of technical teams to ensure the smooth operation of their applications.
With the launch of Log Streaming, we are enhancing our App Services external observability capabilities. This enables you to gain granular insights into application behavior, supporting rapid issue detection and resolution to enhance your Mobile applications’ reliability, availability, performance, and security. The following information can now easily be accessed through real time logs:
- Authentication, access and admin processes in App Services
- App Services interactions with Server buckets and in-memory channel cache
- All documents updates, changes feed requests and DCP-feed processing
- All HTTP requests made to the App Services REST APIs
- Import logs, logging from Access Control and Validation function and sync logs
- Query logs related to App Services routines that are SQL++ queries
How to enable Log Streaming
Log Streaming can be easily enabled in App Services 3.1.2 or higher:
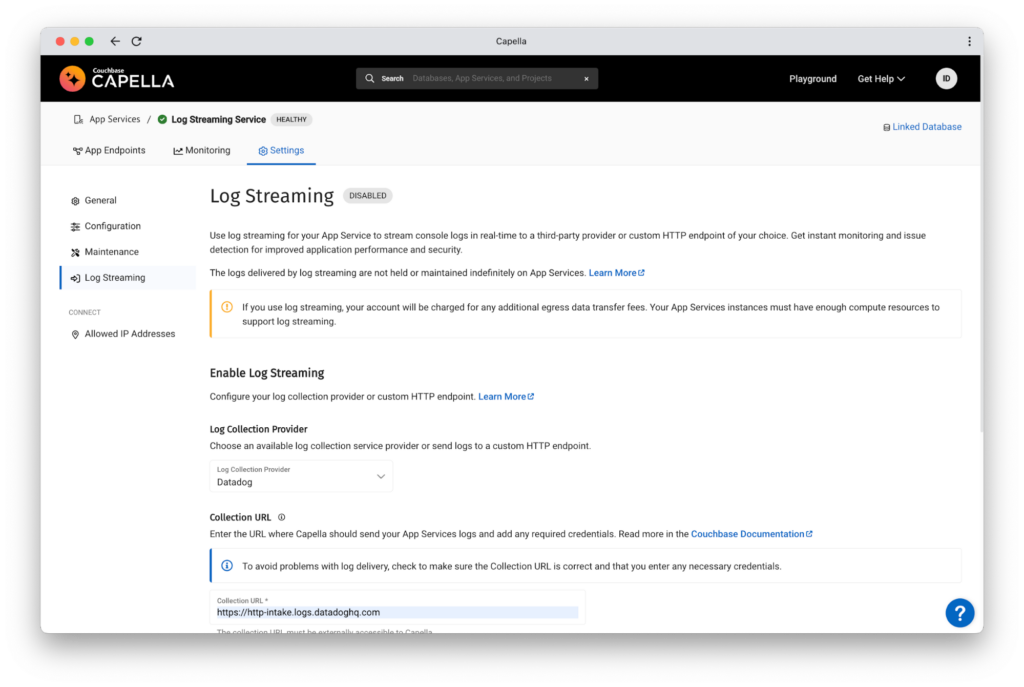
- Log in to your Couchbase Capella dashboard.
- Navigate to your App Service’s Settings page.
- Find and select the Log Streaming option:
- Here, you’ll configure where and how your logs will be sent.
- Example: configure Datadog as your Log Collection Provider:
- For Collection URL, enter the Host Address you obtained from Datadog.
- In Access Credentials, input the Datadog API Key.
For configuring log streaming to any other third-party observability platforms such as SumoLogic or self-hosted HTTP log collectors, change the Log Collection Provider and generate the appropriate target URL and access credentials from the third-party solution.
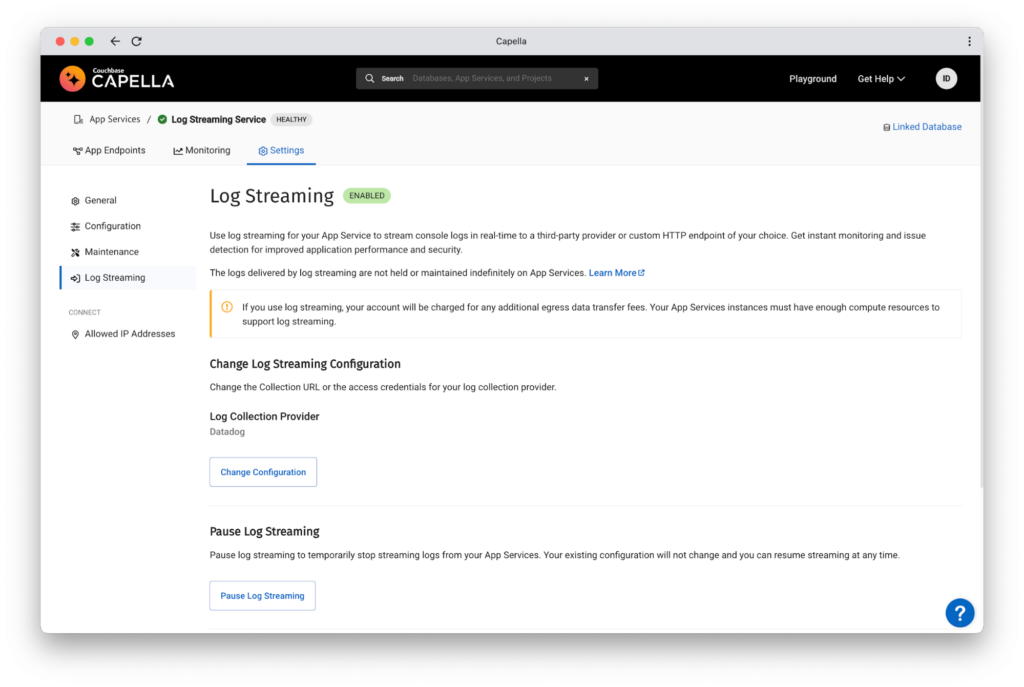
- Enable Log Streaming:
- Click on the option to enable log streaming. This might take a moment as it sets up the collector.
- Monitor the status. Once fully set up, you should see the status transition to “Enabled”, indicating that logs are now streaming from Capella App Services to Datadog.
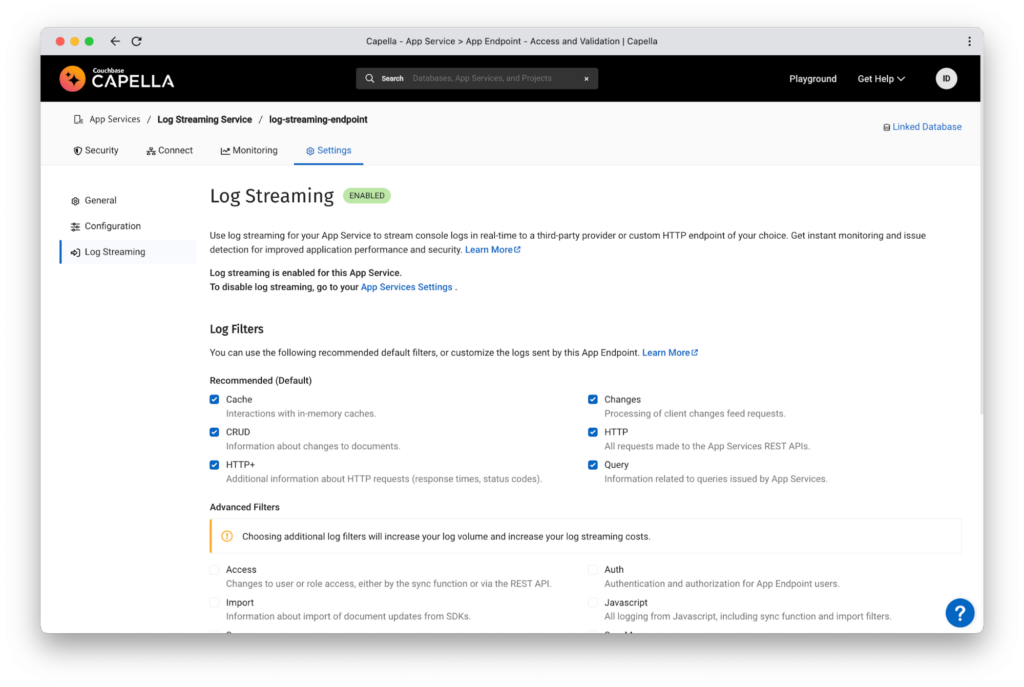
How to configure Log Filters and Levels (Optional)
When Log Streaming is enabled for an App Service, the same defaults for log level (Info) and Optionally, Log Streaming can be configured on a per-App Endpoint basis, allowing for granular configuration of Log Filters and Log Levels to customize to your needs
For more detail on what types of logs and levels of granularity can be utilized, see our Log Streaming documentation.
Other Observability Options
Apart from Log Streaming, Capella App Services already offers different robust options for monitoring operational metrics and status such as the Capella App Services Web UI Metrics and Metrics API, that could be utilized on your App Service.
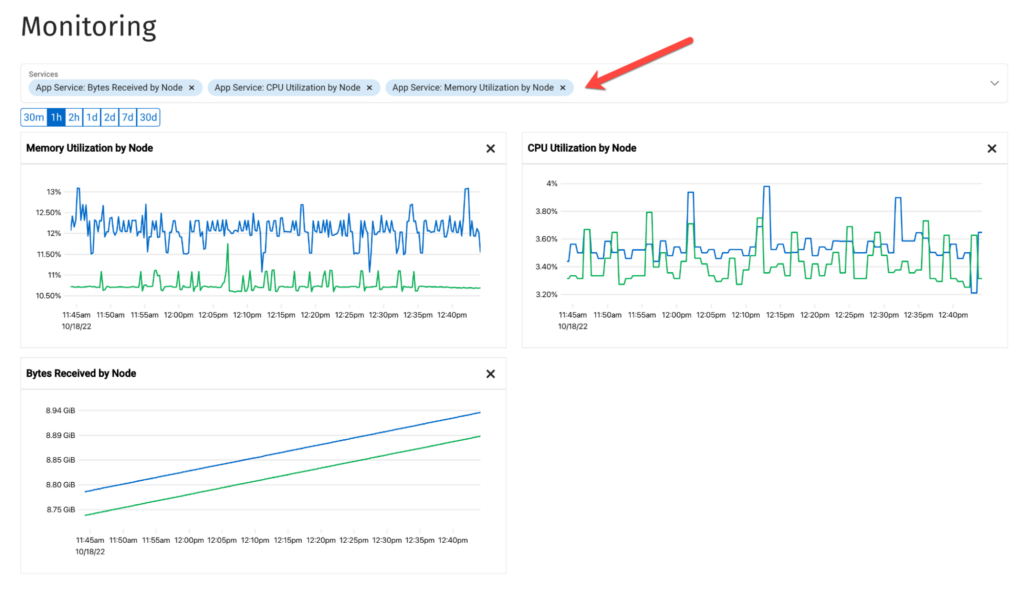
- UI Metrics: out-of-the box through Capella Web UI, see the Monitoring App Endpoints docs. These metrics include CPU and memory utilization (App Service level) per node, auth successes and failures, delta sync requests, documents operations, and active replications (App Endpoint level).
- Metrics API for App Services delivers real-time insights for developers, presenting a detailed array of system operation and performance metrics. This includes granular data on global cluster usage per App Services Node, with additional per-endpoint metrics for nuanced analysis of each node’s endpoints. Dive into specific metrics like Cache utilization, Delta Sync, Import, Couchbase Lite Replication (Push and Pull), and Query operations to fine-tune performance and utilization.
We support the Metrics API in both JSON and Prometheus format and as a result, you can easily set up App Services monitoring with Prometheus and Grafana or any other integration with a third party or self-hosted metrics ingestion pipeline.
Conclusion
The integration of Log Streaming into Capella App Services marks a significant leap forward in operational observability. With real-time data piped directly to your platform of choice—be it Datadog, SumoLogic, or a custom HTTP endpoint—you’re equipped to make swift, informed decisions that bolster your mobile applications’ reliability, performance, and security.
Ready to see the difference Log Streaming can make for your Capella App Services? Upgrade to the latest version and turn insights into action. For those not yet part of Capella, we invite you to sign up for a free trial.
Catch up with the rest of the posts in this series on Capella App Services Log Streaming:
Leave a comment
You must be logged in to post a comment.