Storing data on a Couchbase cluster is a great way to ensure the unrivaled performance and stability of your services. Coupled with our analytics service, Couchbase allows gaining insights into the data without affecting cluster performance. The number of analysis tools that can be used with our database is constantly growing. Recently, we released the first beta version of our data source plugin for Grafana, an open-source data visualization tool that is used by many teams around the world for data analysis and systems monitoring.
The Grafana data source plugin is supported by our community and its sources can be obtained from the GitHub page. We provide pre-built binaries and work on making the installation process as easy as possible. The plugin supports querying Couchbase clusters using SQL++ through our query or analytics services.
Installing the Grafana plugin
To install it, download the latest .zip file from the release page and unpack it into your Grafana plugin directory. You also need to allow Grafana to load the plugin without validating its signature. The installation and configuration procedure is described in detail in Couchbase’s Grafana plugin tutorial.
Using the plugin
After installing the plugin, it is now possible to use Couchbase’s unique SQL++ with Grafana’s powerful visualization capabilities. So, let’s explore them!
Go to the Explore page in Grafana’s UI and select a configured Couchbase data source in the drop-down at the top of the page.
This should switch your query UI to the one provided by our plugin. More features will be added later, but right now the query editor UI is somewhat ascetic – it lets you edit a query, choose the service to run the query with, and submit it to the cluster.
Speaking of query syntax, the plugin supports all cluster SQL++ features, including full-text search and user-defined functions. The plugin expects that submitted queries satisfy the following requirements:
- To apply selected in the standard Grafana UI query time range, the query must include one of the two time range filtering functions in its WHERE section: str_time_range(<field>) and time_range(<field>). These functions accept the name of the field that should be used for time range filters, for example:
1SELECT time, count FROM test WHERE str_time_range(time) - Grafana only supports queries that select scalar values like numbers and strings, but not vector values like arrays and maps, which need to be unnested before they can be displayed in the UI. Because of this, it is recommended to avoid using the asterisk operator in the select clause to make sure that SQL++ queries sent to the plugin select only scalar fields.
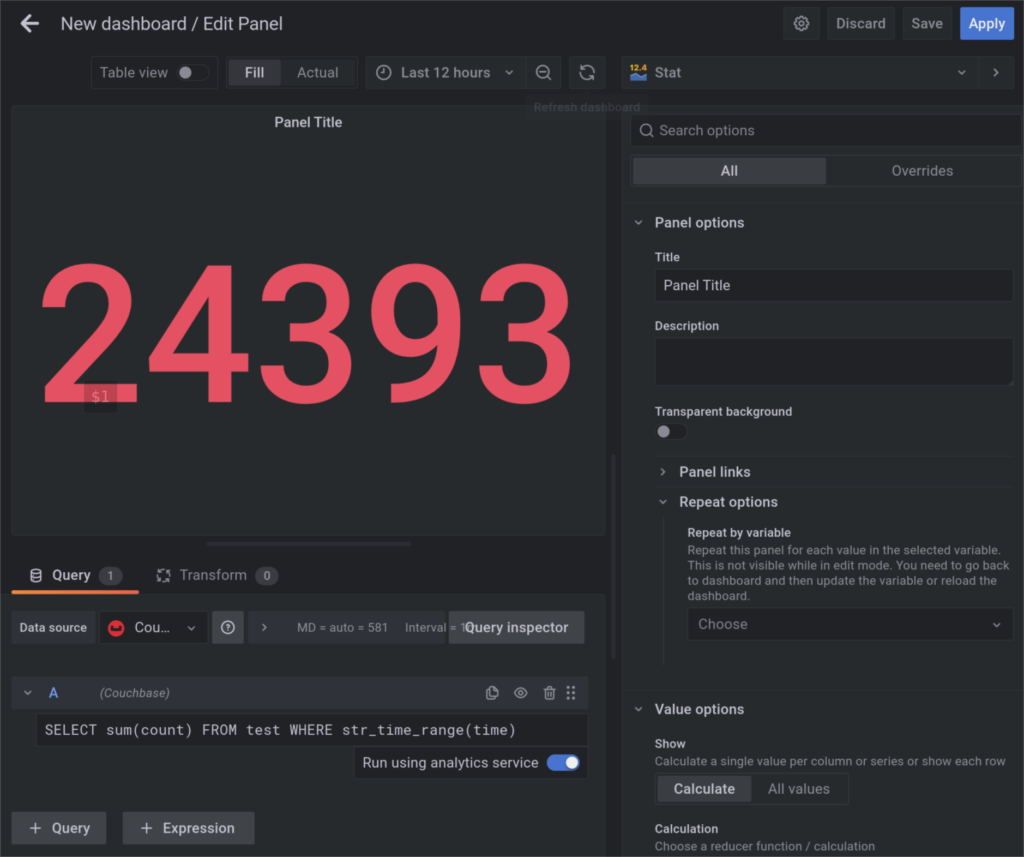
Visualizing the data
After the plugin’s backend receives a response from the cluster, it transforms the results into Grafana data structures that can be displayed in the UI.
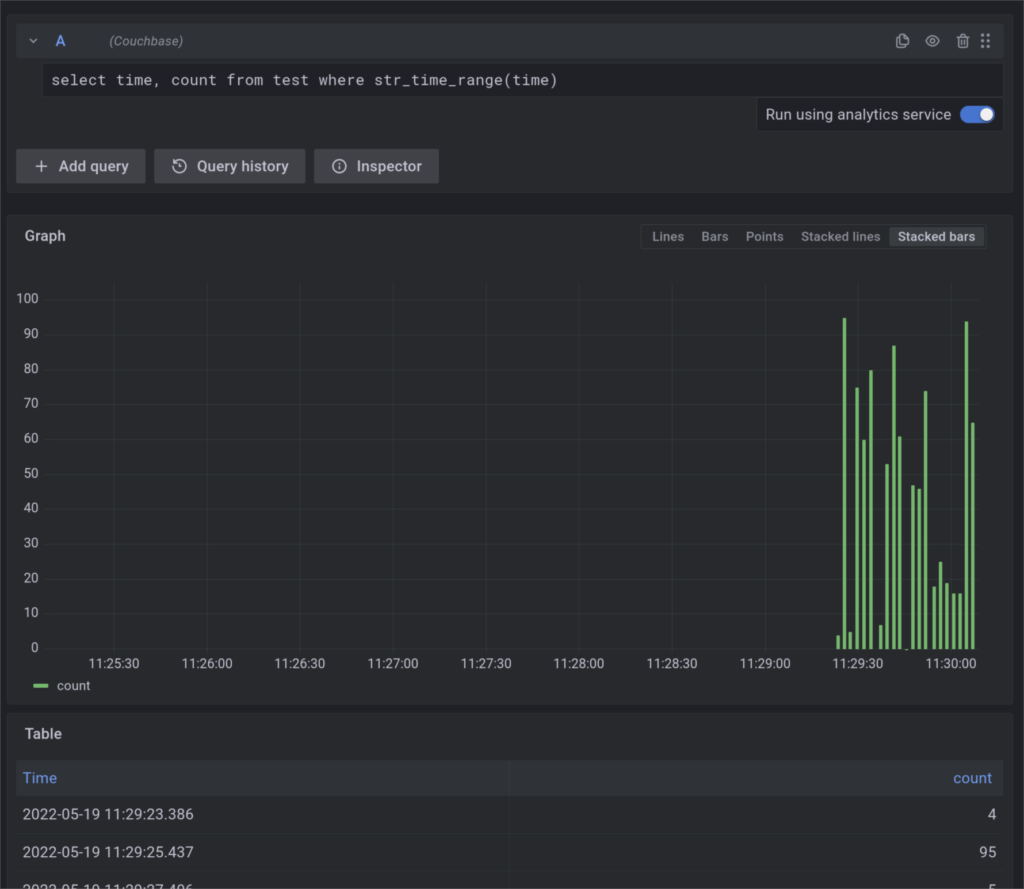
Grafana automatically detects the type of selected data and renders numerical values in the timeline graph:
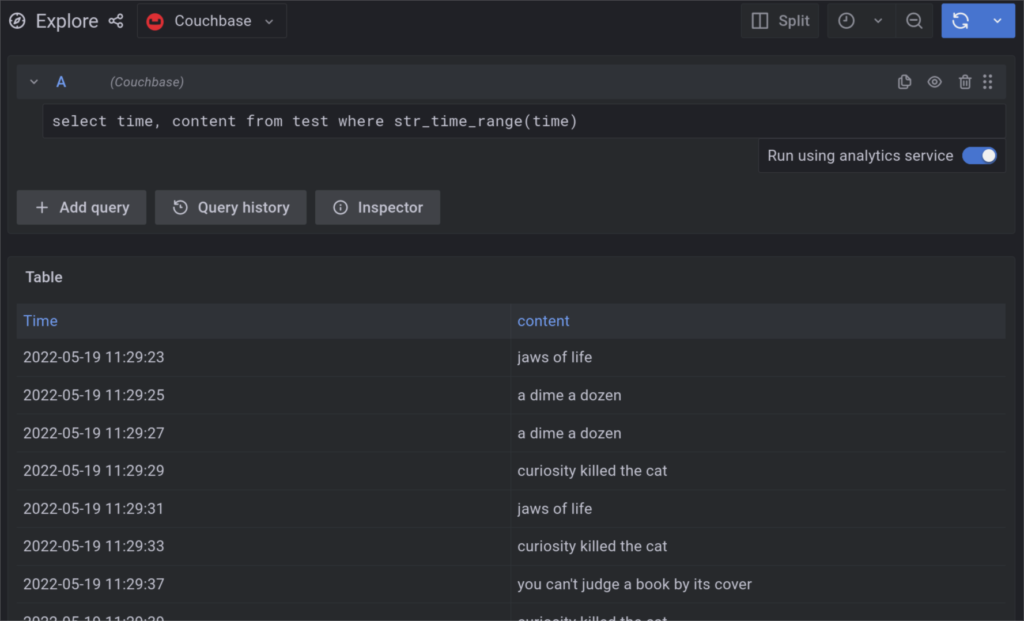
If the result set contains a column named content, the results will be displayed as logs:
The Couchbase data source plugin also allows using SQL++ to power custom Grafana dashboards. For example, an aggregate query can be used to monitor the number of events over a period of time:
More information about building Grafana Dashboards with Couchbase is provided in Couchbase’s Grafana plugin tutorial.
The plugin is being actively developed so, more features are coming. If you have any questions about the plugin, experiencing issues with its installation or usage, we would love to know about them and your general feedback either through our forums or via GitHub issues.