UPDATE: Starting in v2.8, Sync Gateway includes built-in Prometheus exporter support. Stats are exported in Prometheus-compatible format through the metrics endpoint. This implies that there is no longer the need to have a separate exporter. Read the Couchbase Documentation for more details on monitoring Sync Gateway v2.8+ using the new endpoint.
The Couchbase Mobile 2.5 release introduced extensive stats reporting capabilities on the Sync Gateway. The stats provide key insights into the health of your Couchbase Mobile deployment and constitutes an integral part of any deployment.
This is a step-by-step guide for using Prometheus (open source monitoring and alerting) with Sync Gateway clusters on Kubernetes. We will use Grafana for visualizing the stats.
It is often stated that Prometheus and Kubernetes share a “spiritual ancestry”. Both projects are hosted by the Cloud Native Computing Foundation. They are driven by common design goals, making Prometheus very well suited for monitoring Kubernetes deployments.
In a related post, we discussed setting up monitoring with Prometheus on a Couchbase Mobile cluster in an environment without Kubernetes. If you had followed along with that post, you can skip the initial sections and jump right to the Deployment Architecture section.
Background
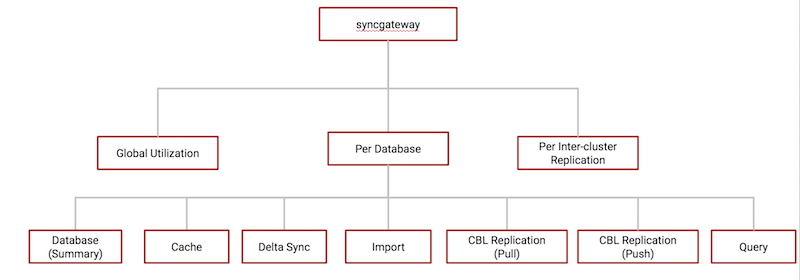
Sync Gateway Stats Reporting
Sync Gateway stats are reported in JSON format and are available through the _expvar endpoint via the Sync Gateway Admin REST interface.
These are the categories of stats that are reported.
Prometheus
Prometheus is an open source system monitoring and alerting platform. At its core, Prometheus Server is responsible for polling “Prometheus targets” for stats and storing them as time-series data. Prometheus targets are statically configured or can be discovered by Prometheus.
Grafana
Grafana is an open-source data visualization and alerting platform. It supports Prometheus as a data source and can be used to build comprehensive dashboards.
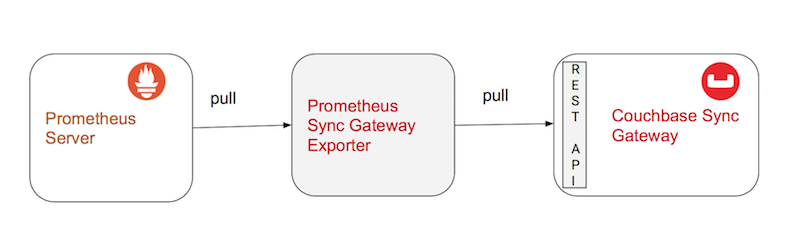
Introducing the Prometheus Sync Gateway Exporter
In order for Prometheus to monitor the Sync Gateway, we need a “Prometheus target” corresponding to the Sync Gateway. This target is the Sync Gateway Exporter, herein referred to as “the Exporter”. Simply put, the Exporter is responsible for exporting Sync Gateway stats to Prometheus metrics.
Deployment Architecture
When we tie all this together, a typical deployment looks like the following:
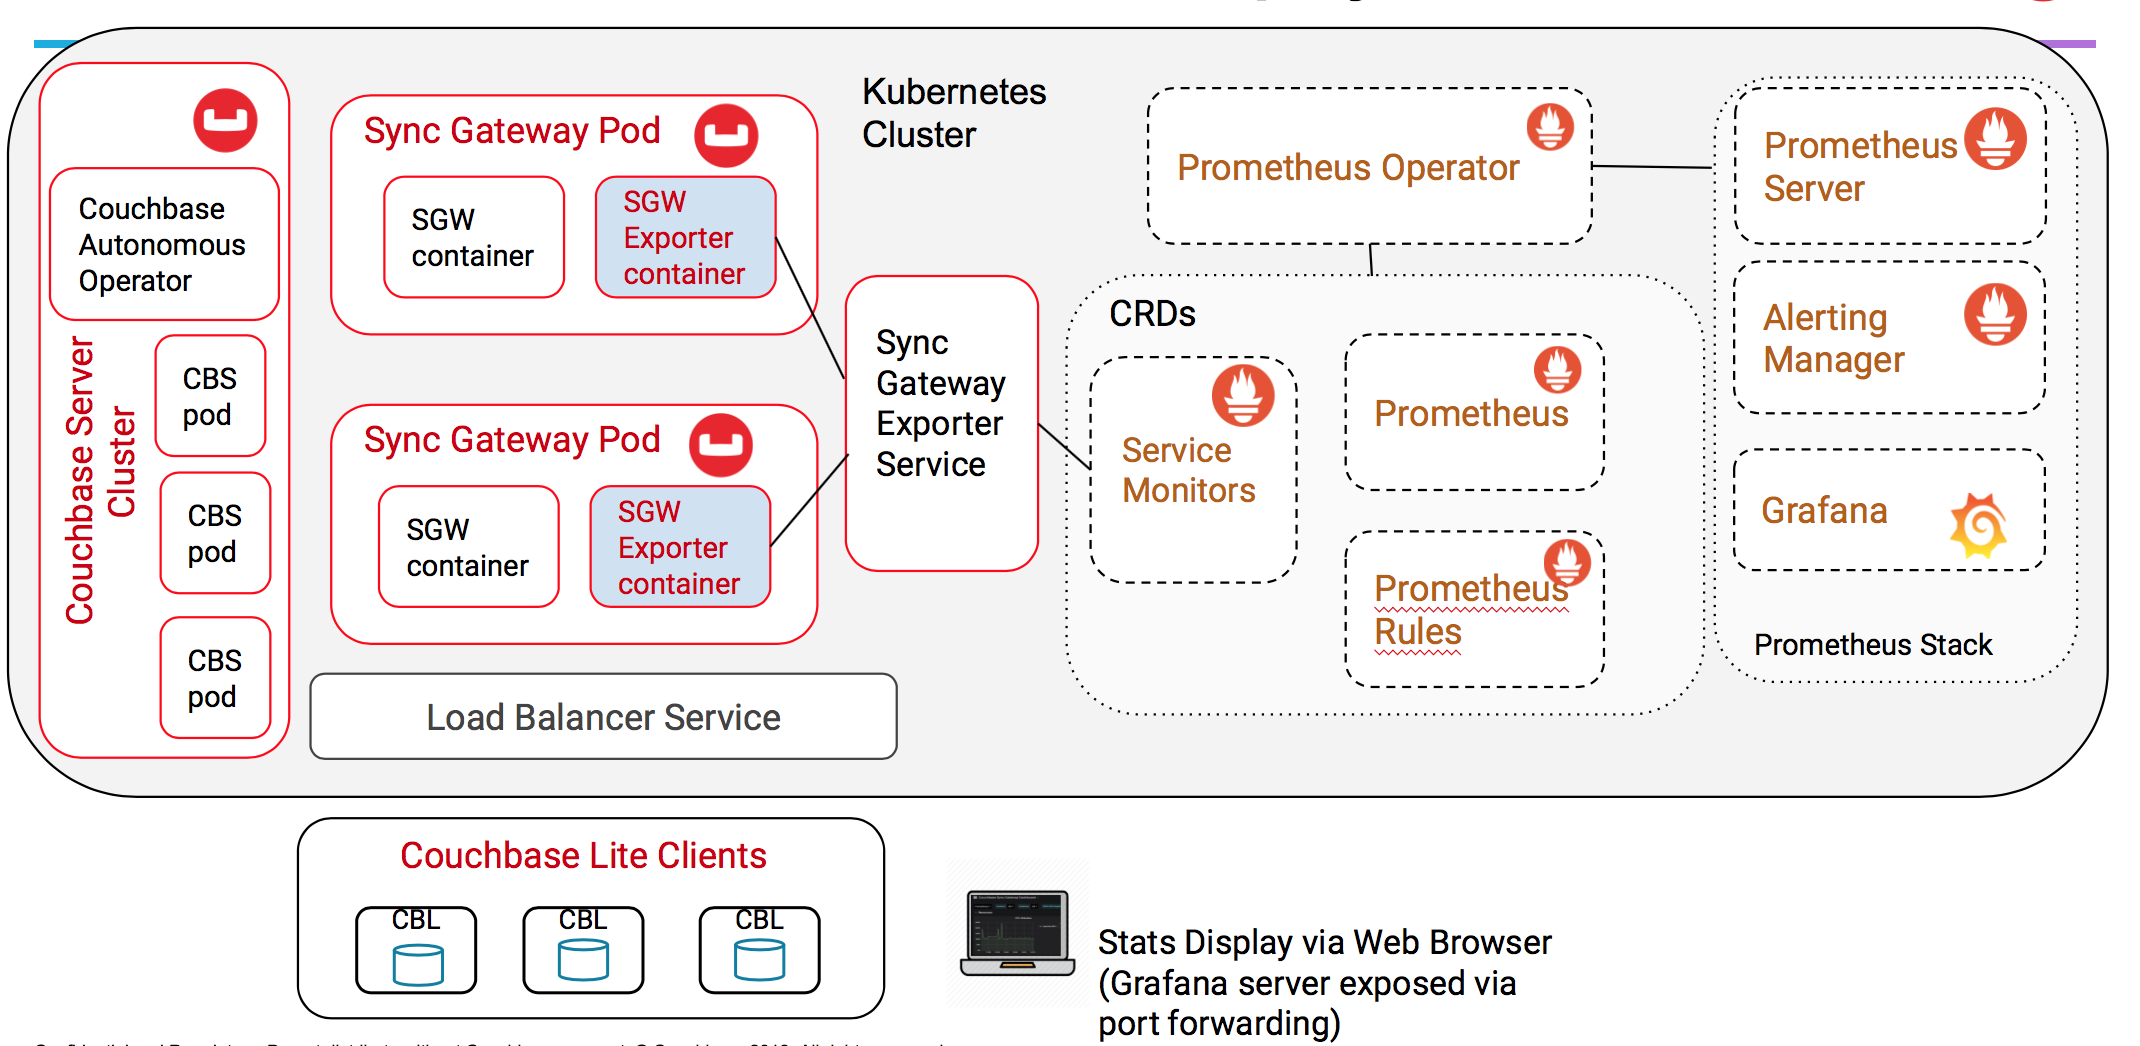
Okay…so it looks a whole lot more complex than it actually is. It is in fact quite straightforward:
Sync Gateway Exporter Container
Exporter and Sync Gateway containers must be co-located in the same pod using the sidecar pattern. The Sync Gateway Admin REST API is, by default, only exposed on localhost. This configuration is strongly recommended in production environments as well. Because the Exporter polls the Sync Gateway Admin API for stats, it needs to be on the same host/node as Sync Gateway.
Also, the Sync Gateway stats are reported on a per-node basis. So in a cluster of two or more Sync Gateway nodes, each Sync Gateway node must have its own Exporter.
Sync Gateway Exporter Service
The Sync Gateway pods containing the Exporter must be exposed to other services on the cluster. In Kubernetes, you do that through a Kubernetes Network Service. The Sync Gateway Exporter Service exposes the Sync Gateway pods and makes it accessible to the Prometheus Service.
Prometheus Operator
Continually polls the Exporter for stats, which in turn polls the Sync Gateway REST endpoint. The server uses the rules defined in the rules.yaml to push alerts to the Alerting Manager. The simplest way to deploy Prometheus on the Kubernetes cluster is using the Prometheus Operator. The Prometheus Operator takes care of deploying the Prometheus stack including the Alerting Manager and Grafana.
The Operator acts on a number of Custom Resource Definitions(CRDs). The most interesting one is the Service Monitor. The Service Monitor is responsible for defining how services are to be monitored. In this case, the Sync Gateway pods that are exposed via the Sync Gateway Exporter Service are monitored.
Grafana
The service polls the Prometheus Server for stats and graphs it on a web-based dashboard that can be accessed via the web browser. To access the Grafana dashboard from outside the cluster, you will need to use port forwarding. You could also expose it using NodePort or the equivalent in Kubernetes. Again, the Prometheus Operator should take care of deploying the same.
Exporter Source Code
The Sync Gateway Exporter is open-source couchbaselabs project and available on GitHub. It is compatible with Couchbase Sync Gateway 2.5+. To that end, while we will strive to keep it up-to-date with the latest release of Sync Gateway, we cannot guarantee that. The good news is that it is open source and includes detailed instructions on how you can extend it to support additional stats.
Clone the Exporter source from Github and update relevant submodules. The repo includes all the yaml config files that would be used for the deployment.
|
1 2 3 |
git clone https://github.com/couchbaselabs/couchbase-sync-gateway-exporter git submodule update --init --rebase --remote --recursive |
The yaml config files referenced in this post are available in the “kubernetes” folder.
|
1 |
cd /path/to/cloned/exporter/source/kubernetes |
Installation
In the remainder of the post, we will walk through the steps to setup monitoring on a Couchbase Mobile cluster on the Kubernetes cluster. The instructions herein should apply to any managed Kubernetes deployment.
Deploying Couchbase Server Cluster
Follow the instructions here to deploy the latest version of the Couchbase Server cluster using Couchbase Autonomous Operator.
Deploying Sync Gateway Cluster
Follow the instructions here to deploy a Sync Gateway cluster on Kubernetes
Deploying Prometheus and Grafana
There are several choices to deploy Prometheus. In fact, most managed Kubernetes services may have options
One of the simplest options is to deploy using the Prometheus Operator using Helm.
The Prometheus chart will deploy the entire monitoring stack including the Prometheus server, Grafana, Alert Manager, etc.
Installing Helm
If you already have Helm running on your cluster, skip this step
|
1 2 3 4 |
kubectl create serviceaccount --namespace kube-system tiller kubectl create clusterrolebinding tiller-cluster-admin --clusterrole=cluster-admin --serviceaccount=kube-system:tiller helm init --service-account tiller --upgrade |
Installing Prometheus
Install the Prometheus Operator by running this command from the root of the cloned repo.
- Create a new configuration file named values.yaml using a text editor. The key thing is the default admin password using to log into the Grafana dashboard. You can change that after the initial login.
- The values.yaml file is also available in the source repo.
|
1 2 3 4 5 6 7 8 9 10 11 12 13 14 15 16 17 18 |
prometheus: prometheusSpec: replicas: 1 image: tag: v2.10.0 serviceMonitorSelectorNilUsesHelmValues: false serviceMonitorNamespaceSelector: {} serviceMonitorSelector: {} ruleSelectorNilUsesHelmValues: false ruleNamespaceSelector: {} ruleSelector: {} prometheusOperator: image: tag: v0.30.0 grafana: adminPassword: admin |
- Deploy the Helm Chart
The Prometheus chart is deployed in the prometheus namespace
|
1 |
helm install --namespace prometheus --name prom stable/prometheus-operator -f values.yaml --version 5.10.4 |
- Verify the installation
The output should show the Pods corresponding to the Prometheus stack
|
1 2 3 4 5 6 7 8 9 10 11 |
kubectl -n prometheus get pods NAME READY STATUS RESTARTS AGE alertmanager-prom-prometheus-operator-alertmanager-0 2/2 Running 0 27d prom-grafana-6459ffb669-6qzht 2/2 Running 9 27d prom-kube-state-metrics-55bc76f8c4-dppcz 1/1 Running 0 27d prom-prometheus-node-exporter-6j9lz 1/1 Running 0 27d prom-prometheus-node-exporter-7wd68 1/1 Running 0 27d prom-prometheus-node-exporter-7wqgz 1/1 Running 0 27d prom-prometheus-operator-operator-6b48475c74-srwwl 1/1 Running 0 27d prometheus-prom-prometheus-operator-prometheus-0 3/3 Running 0 27d |
Deploying Sync Gateway Exporter
With the Prometheus monitoring stack set up, it is time to install the Exporter for monitoring.
The Exporter container will be deployed on the same pod as the Sync Gateway using the sidecar container pattern. To do that, we will update the Sync Gateway cluster Deployment to include the deployment of the Exporter container with couchbasesamples/sync-gateway-prometheus-exporter:latest image available on Docker Hub.
- Open the sgw-deployment.yaml in a text editor and update it to include the Exporter container as shown below.
|
1 2 3 4 5 6 7 8 9 10 11 12 13 14 15 16 17 18 19 20 21 22 23 24 25 26 27 28 29 30 31 32 33 34 35 36 37 38 39 40 41 42 43 44 45 46 47 48 49 50 51 52 53 54 55 |
apiVersion: extensions/v1beta1 kind: Deployment metadata: name: sync-gateway spec: replicas: 1 template: metadata: labels: app: sync-gateway spec: affinity: podAntiAffinity: requiredDuringSchedulingIgnoredDuringExecution: - labelSelector: matchExpressions: - key: app operator: In values: - sync-gateway topologyKey: "kubernetes.io/hostname" containers: - name: sync-gateway image: couchbase/sync-gateway:2.6.0-enterprise args: ["/sync-gateway-config/sgw-config.json"] volumeMounts: - name: sgw-config-volume mountPath: /sync-gateway-config readOnly: true env: - name: GOMAXPROCS value: "1" resources: requests: cpu: 250m limits: cpu: 250m - name: exporter image: couchbasesamples/sync-gateway-prometheus-exporter:latest args: ["--log.level=info"] env: - name: GOMAXPROCS value: "1" ports: - name: http containerPort: 9421 resources: requests: cpu: 100m limits: cpu: 100m volumes: - name: sgw-config-volume secret: secretName: sgw-config |
If you have a Sync Gateway import node, you will have to update sgw-deployment-import.yaml as well.
- Once you update the yaml file, apply it to your cluster
|
1 |
kubectl apply -f sgw-deployment.yaml |
- Verify the status of the deployment. This sample cluster includes two Sync Gateway nodes.
|
1 2 3 4 5 6 7 8 9 10 |
kubectl get pods NAME READY STATUS RESTARTS AGE cb-example-0000 1/1 Running 0 35d cb-example-0001 1/1 Running 0 35d cb-example-0002 1/1 Running 0 35d couchbase-operator-84cd9f6598-6mm8r 1/1 Running 4 56d couchbase-operator-admission-6c974bf6f-77qmk 1/1 Running 0 56d sync-gateway-54b46fdbc6-2c56l 2/2 Running 0 29d sync-gateway-import-b448f69dd-wjd8g 2/2 Running 0 29d |
- You can view the details of Sync Gateway pod and check that it contains exporter container
|
1 2 3 4 5 6 |
kubectl top pod sync-gateway-54b46fdbc6-2c56l --containers POD NAME CPU(cores) MEMORY(bytes) sync-gateway-54b46fdbc6-2c56l sync-gateway 140m 20Mi sync-gateway-54b46fdbc6-2c56l exporter 0m 3Mi |
Deploying Sync Gateway Exporter Service
Next, we deploy a Kubernetes service that exposes the Sync Gateway nodes and makes them available to other nodes in the cluster.
- Create a new configuration file named svc.yaml using a text editor. The svc.yaml file is also available in the source repo.
|
1 2 3 4 5 6 7 8 9 10 11 12 13 14 15 16 |
apiVersion: v1 kind: Service metadata: name: sync-gateway-exporter namespace: couchbase labels: app: sync-gateway spec: ports: - port: 9421 protocol: TCP targetPort: http name: http selector: app: sync-gateway type: ClusterIP |
- Deploy the service
|
1 |
kubectl apply -f svc.yaml |
- Verify the installation. The key point to note in the output is that the service points to the two Sync Gateway endpoints.
|
1 2 3 4 5 6 7 8 9 10 11 12 13 14 15 16 |
kubectl describe service sync-gateway-exporter Name: sync-gateway-exporter Namespace: default Labels: app=sync-gateway Annotations: kubectl.kubernetes.io/last-applied-configuration={"apiVersion":"v1","kind":"Service","metadata":{"annotations":{},"labels":{"app":"sync-gateway"},"name":"sync-gateway-exporter","namespace":"default"},... Selector: app=sync-gateway Type: ClusterIP IP: 10.15.254.14 Port: http 9421/TCP TargetPort: http/TCP Endpoints: 10.12.0.41:9421,10.12.2.42:9421 Session Affinity: None Events: <none> |
Setting up Prometheus Service Monitor
In order for Prometheus to discover the Sync Gateway Exporter service, we will have to define a ServiceMonitor. As discussed earlier, the Prometheus ServiceMonitor specifies how the services should be monitored. The Prometheus Operator generates the Prometheus scrape configuration based on the definition.
- Create a new configuration file named servicemonitor.yaml using a text editor. The servicemonitor.yaml file is also available in the source repo.
|
1 2 3 4 5 6 7 8 9 10 11 12 13 14 15 16 17 18 19 20 21 22 23 24 25 |
apiVersion: monitoring.coreos.com/v1 kind: ServiceMonitor metadata: name: sync-gateway namespace: default labels: app: sync-gateway spec: jobLabel: sync-gateway selector: matchLabels: app: sync-gateway namespaceSelector: matchNames: - default endpoints: - port: http # comment following lines to use the pod IP instead of its name as instance: relabelings: - sourceLabels: [__meta_kubernetes_pod_name] separator: ; regex: (.*) targetLabel: instance replacement: $1 action: replace |
- Deploy the service
|
1 |
kubectl apply -f servicemonitor.yaml |
Configuring Prometheus Alerts
This is an optional step and only required if you want the Prometheus Alerting Manager to send alerts. Alerts are based on a set of configured alerting rules:
- A sample rules.yaml file is available in the source repo. It includes some example rules defined per this specification. You can edit it to suit your environment.
- Apply the rules
|
1 |
kubectl apply -f rules.yaml |
Tying it all together
Verifying Prometheus Monitoring
Now we will verify that the Prometheus ServiceMonitor is able to access and monitor the Sync Gateway Service.
- Enable port forwarding from your local machine to the remote Prometheus server on port 9090. This is only needed for testing purposes. You do not need port forwarding enabled for normal operations.
|
1 |
kubectl -n prometheus port-forward svc/prom-prometheus-operator-prometheus 9090:9090 |
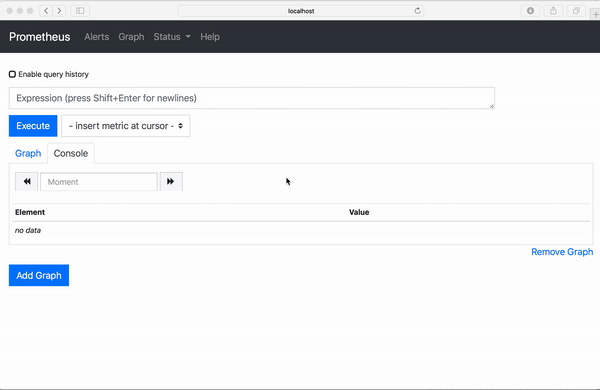
Access the Prometheus webUI on your local browser
|
1 |
open https://localhost:9090 |
If everything goes well, you should see the Sync Gateway Exporter nodes listed in the Targets menu
Verifying Grafana
- Enable port forwarding from your local machine to the remote Grafana server.
|
1 |
kubectl -n prometheus port-forward svc/prom-grafana 3000:80 |
- Access the Grafana dashboard webUI on your local browser.
|
1 |
open https://localhost:3000 |
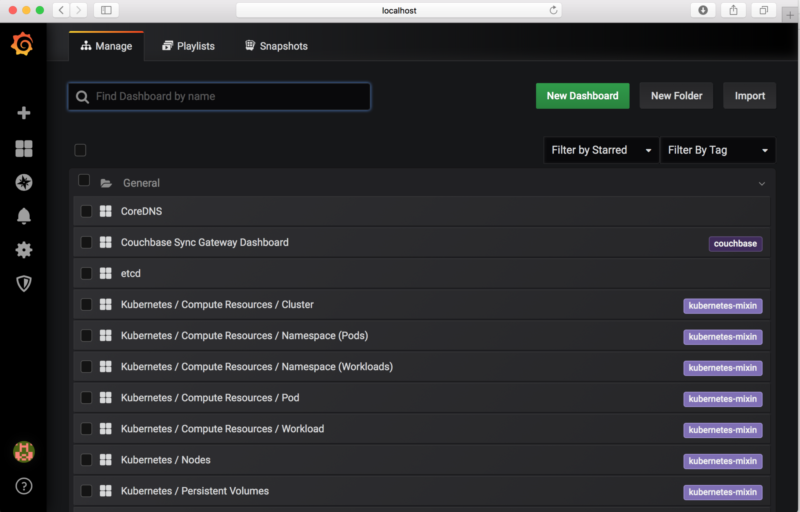
- Log in with the default credentials of “admin” and password of “admin”. You can change it after the initial login. The next step is to set it up with the Sync Gateway dashboard
- A default “Couchbase Sync Gateway” dashboard called
dashboard.jsonnetis available in the source repo as a jsonnet file. - The next step would be to add “Prometheus” as the “Data Source” and import the “Sync Gateway dashboard” JSON file that was generated earlier. You could do this manually by following the menu options. We have simplified this process and provided a script that will do all that for you!
First, ensure that Grafana service is running on port 3000. Run the script from the root of your cloned repo using the command below by runningmakeon thegrafana-devtarget. This does the following:- Regenerates the
dashboard.jsondashboard from thedashboard.jsonnetfile - Uses Grafana API to add Prometheus as a data source
- Uses Grafana API to load the
dashboard.jsongenerated in the previous step
- Regenerates the
|
1 |
make grafana-dev |
Viewing Grafana Stats
- Once the script successfully executes, you should refresh the Grafana web UI on your web browser. You will see the “Couchbase Sync Gateway Dashboard” in the list of available dashboards. The dashboard graphs all the stats reported by Sync Gateway. You can customize the dashboard.
- Click on the “Couchbase Sync Gateway Dashboard” to see the stats. You can filter it by Sync Gateway (if you have more than one) or database
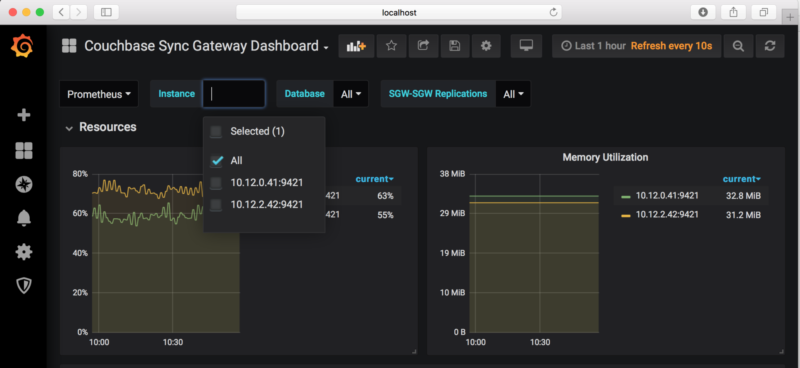
That’s it! You have successfully set up monitoring of Couchbase Sync Gateway Kubernetes with Prometheus. You can now drive replications with Couchbase Lite clients and monitor them.
The default Sync Gateway dashboard is a starting point. You can customize the dashboard, either by editing the dashboard.jsonnet file or directly through the Grafana UI.
What’s Next
Prometheus is well suited for monitoring Kubernetes deployments. By using the Sync Gateway Exporter, you can export Sync Gateway stats to Prometheus and visualize them using visualization tools such as Grafana. This vastly simplifies the monitoring of your Couchbase Mobile clusters.
In addition to the Exporter, we have provided a default Grafana dashboard that you can customize. In addition to customizing the dashboard itself, you can also customize the rules for alerts.
For questions or feedback, please leave a comment below. Or feel free to reach out to me on Twitter @rajagp or email priya.rajagopal@couchbase.com. The Couchbase Forums are another good place to reach out with questions.
Acknowledgments
I would like to thank Carlos Becker for his work on building the first version of the Sync Gateway Exporter.