Prerequisites
As mentioned in Part 1 of the blog, we need to run Prometheus and Grafana in the Kubernetes environment on our Amazon EKS. The recommended way is to use Kube-Prometheus, an Open Source project. Not only will this simplify the deployment, but adds a lot more components, like the Prometheus Node Exporter which monitors Linux host metrics and is typically used in a Kubernetes environment.
Clone the https://github.com/coreos/kube-prometheus repository from Github, but do not create any manifests just yet.
Components included in this package:
- The Prometheus Operator
- Highly available Prometheus
- Highly available Alertmanager
- Prometheus node-exporter
- Prometheus Adapter for Kubernetes Metrics APIs
- kube-state-metrics
- Grafana
|
1 2 3 4 5 6 |
➜ kube-prometheus git:(master) ✗ ls DCO README.md examples jsonnet scripts LICENSE build.sh experimental jsonnetfile.json sync-to-internal-registry.jsonnet Makefile code-of-conduct.md go.mod jsonnetfile.lock.json test.sh NOTICE docs go.sum kustomization.yaml tests OWNERS example.jsonnet hack manifests |
Note:
This tutorial works on the basis that the manifests which bring up the relevant resources for Prometheus Operator are still located in the folder manifests.
Please adjust accordingly if changes have been made as the repository is experimental and subject to change.
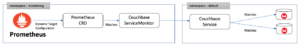
Create the Couchbase ServiceMonitor
The ServiceMonitor tells Prometheus to monitor a Service resource that defines the endpoints Prometheus scrapes for incoming metrics provided by the couchbase-exporter. This file,couchbase-serviceMonitor.yaml, should be kube-prometheus/manifests directory.
|
1 2 3 4 5 6 7 8 9 10 11 12 13 14 15 16 17 |
apiVersion: monitoring.coreos.com/v1 kind: ServiceMonitor metadata: name: couchbase namespace: default # <1> labels: app: couchbase spec: endpoints: - port: metrics # <2> interval: 5s # <3> namespaceSelector: matchNames: - default # <4> selector: matchLabels: app: couchbase # <5> |
Legend:
- You may wish to include our Couchbase
ServiceMonitorin themonitoringnamespace along with the otherServiceMonitors. For examples of this tutorial we have just left it in thedefaultnamespace for ease of use. - The
portcan be a string value and will work for different port numbers of the service as long as the name matches. intervaltells Prometheus how often to scrape the endpoint. Here we want to match the namespace of theServicewill we be creating in the next step,- note that the namespace our
Servicewill be running in must be the same namespace of the Couchbase Cluster we wish to scrape metrics from. - Similar to the
namespaceSelector, this is a simplelabelSelectorthat will select the service we will be creating.
Create the Couchbase Metrics Service
The Service will define the port that we described in our ServiceMonitor at spec.endpoint[0].port earlier. his file,couchbase-service.yaml, should be kube-prometheus/manifests directory.
|
1 2 3 4 5 6 7 8 9 10 11 12 13 14 15 |
apiVersion: v1 kind: Service metadata: name: couchbase-metrics namespace: default # <1> labels: app: couchbase spec: ports: - name: metrics port: 9091 # <2> protocol: TCP selector: app: couchbase couchbase_cluster: cb-example # <3> |
Legend:
- As mentioned previously, make sure that the
Serviceis in the same namespace as the Couchbase cluster that you wish to scrape metrics from, otherwise no pods will be selected and no endpoints will be displayed in Prometheus Targets. Also make sure this value matches up withspec.namespaceSelectorin theServiceMonitor. - Keep this port as its default value of 9091 as this is the port the Couchbase Exporter will be exporting to.
- A further level of granularity to your selector can be added in the scenario you have more than one Couchbase Cluster running in the same namespace.
Prometheus Dynamic Service discovery
Prometheus discovers the monitoring end points, dynamically, by matching the labels on the ServiceMonitor to the Services which specify the cluster and end points, Port 9091 in our case.
Create the Manifests
Follow the specific command given in the Github README to bring up our created resources along with the other provided default manifests.
Components such as Prometheus, AlertManager, NodeExporter and Grafana should then startup and we can confirm this by inspecting the pods in the namespace monitoring.
Let’s begin.
Create the Kubernetes namespace and CRDs
|
1 2 3 4 5 6 7 8 9 10 11 12 13 14 |
kube-prometheus git:(master) $ kubectl create -f manifests/setup namespace/monitoring created customresourcedefinition.apiextensions.k8s.io/alertmanagers.monitoring.coreos.com created customresourcedefinition.apiextensions.k8s.io/podmonitors.monitoring.coreos.com created customresourcedefinition.apiextensions.k8s.io/prometheuses.monitoring.coreos.com created customresourcedefinition.apiextensions.k8s.io/prometheusrules.monitoring.coreos.com created customresourcedefinition.apiextensions.k8s.io/servicemonitors.monitoring.coreos.com created customresourcedefinition.apiextensions.k8s.io/thanosrulers.monitoring.coreos.com created clusterrole.rbac.authorization.k8s.io/prometheus-operator created clusterrolebinding.rbac.authorization.k8s.io/prometheus-operator created deployment.apps/prometheus-operator created service/prometheus-operator created serviceaccount/prometheus-operator created |
Wait for a few minutes before the next step, but it may be necessary to run the command multiple times for all components to be created successfully.
Create the remaining resources
|
1 2 3 4 5 6 7 8 9 10 11 |
kube-prometheus git:(master) $ kubectl create -f manifests/ alertmanager.monitoring.coreos.com/main created secret/alertmanager-main created service/alertmanager-main created serviceaccount/alertmanager-main created servicemonitor.monitoring.coreos.com/alertmanager created service/couchbase-metrics created servicemonitor.monitoring.coreos.com/couchbase created ... servicemonitor.monitoring.coreos.com/kubelet created |
Check monitoring namespaces
Components such as Prometheus, AlertManager, NodeExporter and Grafana should then startup and we can confirm this by inspecting the pods in the namespace monitoring.
|
1 2 3 4 5 6 7 8 9 10 11 12 13 14 15 |
$ kubectl get pods -n monitoring NAME READY STATUS RESTARTS AGE alertmanager-main-0 2/2 Running 0 69m alertmanager-main-1 2/2 Running 0 69m alertmanager-main-2 2/2 Running 0 69m grafana-75d8c76bdd-4l284 1/1 Running 0 69m kube-state-metrics-54dc88ccd8-nntts 3/3 Running 0 69m node-exporter-pk65z 2/2 Running 0 69m node-exporter-s9k9n 2/2 Running 0 69m node-exporter-vhjpw 2/2 Running 0 69m prometheus-adapter-8667948d79-vfcbv 1/1 Running 0 69m prometheus-k8s-0 3/3 Running 1 69m prometheus-k8s-1 3/3 Running 0 69m prometheus-operator-696554666f-9cnnv 2/2 Running 0 89m |
Check that our ServiceMonitor has been created.
|
1 2 3 4 5 6 7 8 9 10 11 12 13 14 15 |
$ kubectl get servicemonitors --all-namespaces NAMESPACE NAME AGE default couchbase 2m33s monitoring alertmanager 2m33s monitoring coredns 2m22s monitoring grafana 2m26s monitoring kube-apiserver 2m22s monitoring kube-controller-manager 2m22s monitoring kube-scheduler 2m21s monitoring kube-state-metrics 2m25s monitoring kubelet 2m21s monitoring node-exporter 2m25s monitoring prometheus 2m22s monitoring prometheus-operator 2m23s |
Check that our Service has been created.
|
1 2 3 4 5 6 7 8 9 10 11 12 13 14 15 16 17 18 19 20 |
$ kubectl get svc --all-namespaces NAMESPACE NAME PORT(S) default cb-example 8091/TCP,8092/TCP,8093/TCP, default cb-example-srv 11210/TCP,11207/TCP default couchbase-metrics 9091/TCP default couchbase-operator 8080/TCP,8383/TCP default couchbase-operator-admission 443/TCP default kubernetes 443/TCP kube-system kube-dns 53/UDP,53/TCP kube-system kubelet 10250/TCP,10255/TCP,4194/TCP,... monitoring alertmanager-main 9093/TCP monitoring alertmanager-operated 9093/TCP,9094/TCP,9094/UDP monitoring grafana 3000/TCP monitoring kube-state-metrics 8443/TCP,9443/TCP monitoring node-exporter 9100/TCP monitoring prometheus-adapter 443/TCP monitoring prometheus-k8s 9090/TCP monitoring prometheus-operated 9090/TCP monitoring prometheus-operator 8443/TCP |
In the above output, we not only see the services, but also the ports. We will use this information to forward these ports, like we did with the Couchbase Administration UI, in order to access these services.
To check that all is working correctly with the Prometheus Operator deployment, run the following command to view the logs:
|
1 |
$ kubectl logs -f deployments/prometheus-operator -n monitoring prometheus-operator |
Port forwarding
We have already forwarded the Couchbase Admin UI port 8091 from one Couchbase node previously, but I’m giving this again, this time from the service point of view.
In addition to that port, we actually need only the Grafana service access, Port 3000. However, let’s access Prometheus service Port 9090 as well. Then we can take a look at all the metrics from the different exporters and try a little PromQL, the Prometheus Query Language as well.
Now, the 3 above should be sufficient. However, there’s some additional advantage of taking a look at the metrics from each individual service as well. The Couchbase exporter exposes the Couchbase metrics on Port 9091. So, we can forward those ports as well. Note that you really need only access to Grafana.
|
1 2 3 4 5 6 |
kubectl --namespace default port-forward svc/cb-example 8091 & kubectl --namespace monitoring port-forward svc/prometheus-k8s 9090 & kubectl --namespace monitoring port-forward svc/grafana 3000 & kubectl --namespace monitoring port-forward svc/alertmanager-main 9093 & kubectl --namespace monitoring port-forward svc/node-exporter 9100 & kubectl --namespace default port-forward svc/couchbase-metrics 9091 & |
Check out Prometheus Targets
Access: http://localhost:9090/targets
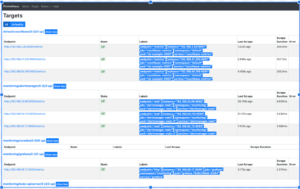
All Prometheus targets should be UP. There are quite a few of these since Kube-Prometheus deployed a bunch of exporters.
Check out the raw Couchbase Metrics
Access: http://localhost:9091/metrics
|
1 2 3 4 5 6 7 8 9 10 11 12 |
# HELP cbbucketinfo_basic_dataused_bytes basic_dataused # TYPE cbbucketinfo_basic_dataused_bytes gauge cbbucketinfo_basic_dataused_bytes{bucket="pillow"} 1.84784896e+08 cbbucketinfo_basic_dataused_bytes{bucket="travel-sample"} 1.51648256e+08 # HELP cbbucketinfo_basic_diskfetches basic_diskfetches # TYPE cbbucketinfo_basic_diskfetches gauge cbbucketinfo_basic_diskfetches{bucket="pillow"} 0 cbbucketinfo_basic_diskfetches{bucket="travel-sample"} 0 # HELP cbbucketinfo_basic_diskused_bytes basic_diskused # TYPE cbbucketinfo_basic_diskused_bytes gauge cbbucketinfo_basic_diskused_bytes{bucket="pillow"} 1.98967788e+08 cbbucketinfo_basic_diskused_bytes{bucket="travel-sample"} 1.91734038e+08 |
This output is useful as you can rapidly search through the list.
Try a basic PromQL query
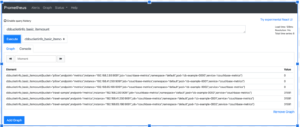
In the above UI, click on Graph first.
The drop box gives you the list of metrics scraped. This is the complete list of all the metrics scraped by all the exporters and that’s a pretty daunting list. One method to narrow down the list to just Couchbase metrics, is of course, to access the 9091 endpoint as previously described.
Check out Grafana
Access: http://localhost:3000

Userid and password are: admin/admin
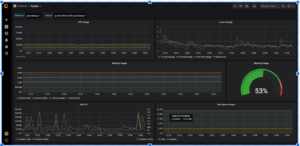
The kube-prometheus deployment of Grafana already has the Prometheus Data Source defined and a large set of Default Dashboards. Let’s check out the Default Node Dashboard
Build a Sample Grafana Dashboard to Monitor Couchbase Metrics
We will not be building a complete Dashboard, but a small sample with a few panels to show how it’s done. This dashboard will monitor the number of items in a bucket and the number of GET and SET operations.
Note: Please have the pillow-fight application running as described in Part 1. This will generate the operations which we are interested in monitoring.
Prometheus Metrics
Access: http://localhost:9091/graph
We are interested in the current items in a bucket. There are a couple of metrics which supply that, cluster wide and per node. Let’s use the per node metric. We will then allow Prometheus to handle all aggregations, as per best practices. Another advantage is that we can even show the current items in the bucket, per node basis just to check if our data set is skewed.
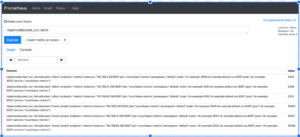
Let’s take a look at one Element:
|
1 |
cbpernodebucket_curr_items{bucket="pillow",endpoint="metrics",instance="192.168.2.93:9091",job="couchbase-metrics",namespace="default",node="cb-example-0000.cb-example.default.svc:8091",pod="cb-example-0000",service="couchbase-metrics"} |
In the above example, we are interested in these labels: bucket, part of node (the middle part, cb-example which is the cluster name, and pod. We are also interested in service in order to filter. These will help us design a dashboard where we can view the metrics by bucket, node or cluster.
The Sample Dashboard
Lets create a new blank sample dashboard.

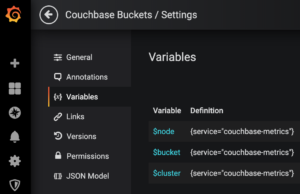
Adding variables
Since we want the metrics per bucket, node and cluster, let’s add these variables so that they can be selected in a drop box.
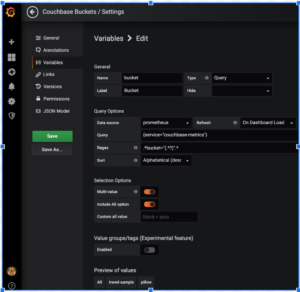
The above example creates the variable bucket. Note the Query and Regex expression.
Let’s create 2 more so that we have 3 variables:
The Query does not change for these 3, but here are the Regex expressions:
|
1 2 3 4 5 |
Query: {service="couchbase-metrics"} $node: Regex= .*pod="(.*?)".* $bucket: Regex= .*bucket="(.*?)".* $cluster: Regex=.*node=\".*\.(.*)\..*\..*:8091\".* |
Creating a Panel
Create 3 Panels for Current Items, GETs and SETs
You can duplicate each panel and edit them. These are the queries:
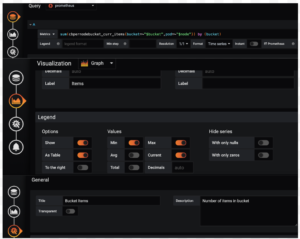
Items Panel: sum(cbpernodebucket_curr_items{bucket=~”$bucket”,pod=~”$node”}) by (bucket)
GETs Panel: sum(cbpernodebucket_cmd_get{bucket=~”$bucket”,pod=~”$node”}) by (bucket)
SETs Panel: sum(cbpernodebucket_cmd_set{bucket=~”$bucket”,pod=~”$node”}) by (bucket)
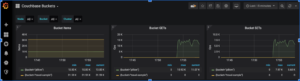
The completed sample Grafana Dashboard
This is how our final sample dashboard looks like.
Clean Up
Finally clean up your deployment:
|
1 2 3 4 5 6 7 |
kube-prometheus git:(master) $ kubectl delete --ignore-not-found=true -f manifests/ -f manifests/setup cao-2 $ kubectl delete -f pillowfight-data-loader.yaml cao-2 $ kubectl delete -f my-cluster.yaml cao-2 $ bin/cbopcfg | kubectl delete -f - cao-2 $ kubectl delete -f crd.yaml cao-2 $ eksctl delete cluster --region=us-east-1 --name=prasadCAO2 |
Resources:
- Download Couchbase Autonomous Operator 2.0 Beta for Kubernetes
- Getting started Couchbase Autonomous Operator 2.0 Beta
- Tutorial – Couchbase Autonomous Operator on EKS
- Share your thoughts on the Couchbase Forums