We recently announced the latest preview of the Couchbase Autonomous Operator (CAO) 2.0 beta. This release is a significant update to the Couchbase Autonomous Operator. Couchbase Autonomous Operator 2.0 introduces several new enterprise-grade features with fully autonomous capabilities – security, monitoring, high-availability, and manageability. In this blog, we will examine in-depth how one of those works.
Prometheus Metrics Collection
The latest operator provides native integration with the Couchbase Prometheus Exporter for collecting and exposing Couchbase Server metrics. These exported metrics can be scraped by Prometheus and then visualized in tools like Grafana.
We will describe the steps to deploy the cluster with the Couchbase Prometheus Exporter and look at some of the metrics through Grafana. This will be a simple single cluster test deployment and will not detail all the other necessary steps for a production level deployment.
We will be closely following the Couchbase Autonomous Operator 2.0 Beta tutorial on installing on Amazon EKS.
Prerequisites
I assume you already have an Amazon Virtual Private Cloud (VPC) to use. Follow the documentation on Getting Started with Amazon EKS and install the following:
Deployment Architecture
A quick overview of the architecture of our deployment.
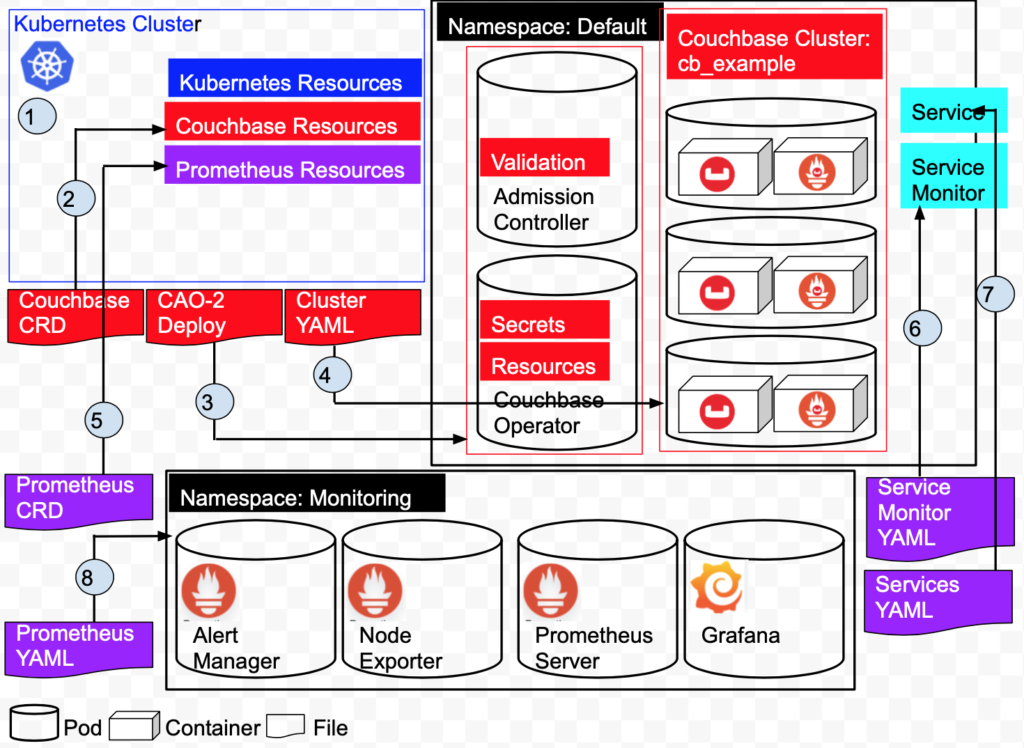
Referring the above diagram:
1: Create the Kubernetes cluster on Amazon EKS. The cluster manages Kubernetes Resources and Services.
2: Add Couchbase Resources by installing the Couchbase Custom Resource Definitions.
3: Install the Couchbase Autonomous Operator. This creates 2 Pods, the Operator and the Admission Controller in the Default namespace.
4: Deploy a 3 node Couchbase Cluster in the Default namespace. This creates 3 pods, each pod has a Couchbase 6.5.0 container and a Couchbase Metrics Exporter container.
5: Create a ServiceMonitor which tells Prometheus to monitor a Service resource that defines the endpoints Prometheus scrapes.
6: Create a Service will define the port that we described in our ServiceMonitor at earlier in the Default namespace.
7: Add Prometheus Resources by installing the Prometheus Custom Resource Definitions.
8: Create the Prometheus/Grafana Pods in the Monitoring namespace.
Create the Cluster and Configure kubectl
|
1 2 3 4 5 6 7 8 9 10 11 12 13 14 15 16 17 18 19 20 21 22 23 24 25 26 27 28 29 30 31 32 33 34 35 36 37 38 39 40 41 42 43 44 |
$ eksctl create cluster \ --name prasadCAO2 \ --region us-east-1 \ --zones us-east-1a,us-east-1b,us-east-1c \ --nodegroup-name standard-workers \ --node-type t3.medium \ --nodes 3 \ --nodes-min 1 \ --nodes-max 4 \ --ssh-access \ --ssh-public-key ~/couchbase-prasad.pub \ --managed [ℹ] eksctl version 0.16.0 [ℹ] using region us-east-1 [ℹ] subnets for us-east-1a - public:192.168.0.0/19 private:192.168.96.0/19 [ℹ] subnets for us-east-1b - public:192.168.32.0/19 private:192.168.128.0/19 [ℹ] subnets for us-east-1c - public:192.168.64.0/19 private:192.168.160.0/19 [ℹ] using SSH public key "/Users/krishna.doddi/couchbase-prasad.pub" as "eksctl-prasadCAO2-nodegroup-standard-workers-42:57:cd:cb:28:33:4a:d9:59:4e:73:3b:c0:e8:a3:fe" [ℹ] using Kubernetes version 1.14 [ℹ] creating EKS cluster "prasadCAO2" in "us-east-1" region with managed nodes [ℹ] will create 2 separate CloudFormation stacks for cluster itself and the initial managed nodegroup [ℹ] if you encounter any issues, check CloudFormation console or try 'eksctl utils describe-stacks --region=us-east-1 --cluster=prasadCAO2' [ℹ] CloudWatch logging will not be enabled for cluster "prasadCAO2" in "us-east-1" [ℹ] you can enable it with 'eksctl utils update-cluster-logging --region=us-east-1 --cluster=prasadCAO2' [ℹ] Kubernetes API endpoint access will use default of {publicAccess=true, privateAccess=false} for cluster "prasadCAO2" in "us-east-1" [ℹ] 2 sequential tasks: { create cluster control plane "prasadCAO2", create managed nodegroup "standard-workers" } [ℹ] building cluster stack "eksctl-prasadCAO2-cluster" [ℹ] deploying stack "eksctl-prasadCAO2-cluster" [ℹ] building managed nodegroup stack "eksctl-prasadCAO2-nodegroup-standard-workers" [ℹ] deploying stack "eksctl-prasadCAO2-nodegroup-standard-workers" [✔] all EKS cluster resources for "prasadCAO2" have been created [✔] saved kubeconfig as "/Users/krishna.doddi/.kube/config" [ℹ] nodegroup "standard-workers" has 3 node(s) [ℹ] node "ip-192-168-13-207.ec2.internal" is ready [ℹ] node "ip-192-168-62-181.ec2.internal" is ready [ℹ] node "ip-192-168-93-184.ec2.internal" is ready [ℹ] waiting for at least 1 node(s) to become ready in "standard-workers" [ℹ] nodegroup "standard-workers" has 3 node(s) [ℹ] node "ip-192-168-13-207.ec2.internal" is ready [ℹ] node "ip-192-168-62-181.ec2.internal" is ready [ℹ] node "ip-192-168-93-184.ec2.internal" is ready [ℹ] kubectl command should work with "/Users/krishna.doddi/.kube/config", try 'kubectl get nodes' [✔] EKS cluster "prasadCAO2" in "us-east-1" region is ready |
|
1 2 3 4 5 6 7 8 9 10 11 12 |
$ kubectl get svc NAME TYPE CLUSTER-IP EXTERNAL-IP PORT(S) AGE kubernetes ClusterIP 10.100.0.1 <none> 443/TCP 15m $ kubectl get nodes NAME STATUS ROLES AGE VERSION ip-192-168-13-207.ec2.internal Ready <none> 4d4h v1.14.9-eks-1f0ca9 ip-192-168-62-181.ec2.internal Ready <none> 4d4h v1.14.9-eks-1f0ca9 ip-192-168-93-184.ec2.internal Ready <none> 4d4h v1.14.9-eks-1f0ca9 |
Configure kubectl
This command is vital as it sets the relevant Amazon Resource Name (ARN) variables in ~/.kube/config. Optionally, you can add --region regionName to specify a cluster in a region that is different than the default. (Your default region should have been specified when you first setup the AWS CLI through aws configurecommand.)
|
1 2 3 |
$ aws eks update-kubeconfig --name prasadCAO2 Added new context arn:aws:eks:us-east-1:429712224361:cluster/prasadCAO2 to /Users/krishna.doddi/.kube/config |
Install the Custom Resource Definitions (CRD)
Note: I downloaded the Operator for MacOS, renamed the package from couchbase-autonomous-operator-kubernetes_2.0.0-macos-x86_64 to cao-2 and cd’d into this directory.
The first step in installing the Operator is to install the custom resource definitions (CRD) that describe the Couchbase resource types.
|
1 2 3 4 5 6 7 8 9 10 11 12 |
cao-2 $ kubectl create -f crd.yaml customresourcedefinition.apiextensions.k8s.io/couchbasebuckets.couchbase.com created customresourcedefinition.apiextensions.k8s.io/couchbaseephemeralbuckets.couchbase.com created customresourcedefinition.apiextensions.k8s.io/couchbasememcachedbuckets.couchbase.com created customresourcedefinition.apiextensions.k8s.io/couchbasereplications.couchbase.com created customresourcedefinition.apiextensions.k8s.io/couchbaseusers.couchbase.com created customresourcedefinition.apiextensions.k8s.io/couchbasegroups.couchbase.com created customresourcedefinition.apiextensions.k8s.io/couchbaserolebindings.couchbase.com created customresourcedefinition.apiextensions.k8s.io/couchbaseclusters.couchbase.com created customresourcedefinition.apiextensions.k8s.io/couchbasebackups.couchbase.com created customresourcedefinition.apiextensions.k8s.io/couchbasebackuprestores.couchbase.com created |
Install the Autonomous Operator 2.0
|
1 2 3 4 5 6 7 8 9 10 11 12 13 14 15 |
cao-2 $ bin/cbopcfg | kubectl create -f - serviceaccount/couchbase-operator-admission created clusterrole.rbac.authorization.k8s.io/couchbase-operator-admission created clusterrolebinding.rbac.authorization.k8s.io/couchbase-operator-admission created secret/couchbase-operator-admission created deployment.apps/couchbase-operator-admission created service/couchbase-operator-admission created mutatingwebhookconfiguration.admissionregistration.k8s.io/couchbase-operator-admission created validatingwebhookconfiguration.admissionregistration.k8s.io/couchbase-operator-admission created serviceaccount/couchbase-operator created role.rbac.authorization.k8s.io/couchbase-operator created rolebinding.rbac.authorization.k8s.io/couchbase-operator created deployment.apps/couchbase-operator created service/couchbase-operator created |
Check the status of the Operator
|
1 2 3 4 5 |
cao-2 $ kubectl get deployments NAME READY UP-TO-DATE AVAILABLE AGE couchbase-operator 1/1 1 1 96s couchbase-operator-admission 1/1 1 1 97s |
The Operator is ready to deploy CouchbaseCluster resources when both the Dynamic Admission Controller (couchbase-operator-admission) and Operator (couchbase-operator) deployments are fully ready and available.
Prepare the Couchbase Cluster Configuration
I’ll deploy a 3 node Couchbase Server 6.5.0 Cluster with Prometheus Couchbase Exporter. For this, I created my-cluster.yaml file in the current directory. This is just my sample. Here is the file:
|
1 2 3 4 5 6 7 8 9 10 11 12 13 14 15 16 17 18 19 20 21 22 23 24 25 26 27 28 29 30 31 32 33 34 35 36 37 38 39 40 41 42 43 44 45 46 47 48 49 50 51 52 53 54 55 56 57 58 59 60 61 62 63 64 65 66 67 68 69 70 71 72 73 74 |
apiVersion: v1 kind: Secret metadata: name: cb-example-auth type: Opaque data: username: QWRtaW5pc3RyYXRvcg== # Administrator password: cGFzc3dvcmQ= # password --- apiVersion: couchbase.com/v2 kind: CouchbaseCluster metadata: name: cb-example spec: image: couchbase/server:6.5.0 security: adminSecret: cb-example-auth paused: false antiAffinity: true softwareUpdateNotifications: true serverGroups: - us-east-1a - us-east-1b - us-east-1c securityContext: runAsUser: 1000 runAsNonRoot: true fsGroup: 1000 platform: aws cluster: clusterName: cb-example dataServiceMemoryQuota: 512Mi indexServiceMemoryQuota: 256Mi searchServiceMemoryQuota: 256Mi indexStorageSetting: memory_optimized autoFailoverTimeout: 120s autoFailoverMaxCount: 3 autoFailoverOnDataDiskIssues: true autoFailoverOnDataDiskIssuesTimePeriod: 120s autoFailoverServerGroup: false autoCompaction: databaseFragmentationThreshold: percent: 30 size: 1Gi viewFragmentationThreshold: percent: 30 size: 1Gi parallelCompaction: false timeWindow: start: 02:00 end: 06:00 abortCompactionOutsideWindow: true tombstonePurgeInterval: 72h servers: - size: 3 name: all_services services: - data - index - query - search buckets: managed: false selector: matchLabels: cluster: cb-example monitoring: prometheus: enabled: true image: couchbase/exporter:1.0.1 resources: requests: cpu: 100m memory: 100Mi |
Notes:
- I have used only a minimum set of configuration parameters. Please refer to the Couchbase Cluster Resource documentation for a complete list.
- Included the secrets section in the same file to keep things simple.
- Used only the Data, Query, Index and Search services.
- Managing my own buckets instead of leaving it to the Operator.
- Make a note of the cluster label cb-example as this will be used by Prometheus to discover the service later.
Tip: Make sure that buckets.managed is set to false. Otherwise, if you create a bucket manually once the cluster is up and running, Kubernetes will automatically drop it.
Deploy the Couchbase Cluster
|
1 2 3 4 |
cao-2 $ kubectl create -f my-cluster.yaml secret/cb-example-auth created couchbasecluster.couchbase.com/cb-example created |
Both the secret as well as the cluster are created. This does not mean they are up and running yet, for that you will have to verify as described in the next step.
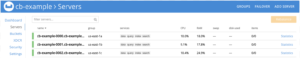
Verify the deployment
|
1 2 3 4 5 6 7 8 |
cao-2 $ kubectl get pods NAME READY STATUS RESTARTS AGE cb-example-0000 2/2 Running 0 9m5s cb-example-0001 2/2 Running 0 8m53s cb-example-0002 2/2 Running 0 8m42s couchbase-operator-5c4bd54bbf-fcj9m 1/1 Running 0 10m couchbase-operator-admission-6789cd5847-w9rfd 1/1 Running 0 10m |
Make sure that all the pods are Ready and Running. In case there is some problem, you can get the logs from the Operator.
Optional: Get the Logs
If you encounter any problems in the previous step, you can check the logs as shown below.
|
1 2 3 4 5 6 7 8 |
cao-2 $ kubectl logs couchbase-operator-5c4bd54bbf-fcj9m {"level":"info","ts":1586879846.061044,"logger":"main","msg":"couchbase-operator","version":"2.0.0","revision":"release"} ...... {"level":"info","ts":1586879986.2216492,"logger":"cluster","msg":"Pod added to cluster","cluster":"default/cb-example","name":"cb-example-0002"} {"level":"info","ts":1586879987.0798743,"logger":"couchbaseutil","msg":"Rebalancing","cluster":"default/cb-example","progress":0} {"level":"info","ts":1586879993.087347,"logger":"cluster","msg":"Rebalance completed successfully","cluster":"default/cb-example"} {"level":"info","ts":1586879993.124682,"logger":"cluster","msg":"Reconcile completed","cluster":"default/cb-example"} |
Here, the Couchbase cluster deployed without any errors.
Optional: Examine a Couchbase pod.
Let’s describe a Couchbase pod to check what its running.
|
1 2 3 4 5 6 7 8 9 10 11 12 13 14 15 16 17 18 19 20 21 22 23 24 25 26 27 28 29 |
cao-2 $ kubectl describe pod cb-example-0000 Name: cb-example-0000 Namespace: default ... Labels: app=couchbase couchbase_cluster=cb-example ... {"containers":[{"name":"couchbase-server","image":"couchbase/server:6.5.0","ports":[{"name":"admin","containerPort":8091,"protocol":"TCP"} ... server.couchbase.com/version: 6.5.0 Status: Running ... Controlled By: CouchbaseCluster/cb-example Containers: couchbase-server: Container ID: docker://7b0e5df433582ad432114248fdce922fd92f63435b110265b823c013fea8c2ac Image: couchbase/server:6.5.0 ... State: Running ... metrics: Container ID: docker://b4406ec41d2119978971c8fa41fb8077ace782611298ba23d254a0d4383ab5ca Image: couchbase/exporter:1.0.0 Image ID: ... Port: 9091/TC ... State: Running |
From the output above, we see that each Couchbase pod is running 2 containers. The first is running Couchbase Server 6.5.0 and and the other is running the Couchbase Prometheus Exporter which is using Port 9091.
Access the Couchbase Administration UI
In an actual production environment, you would typically deploy using DNS and a LoadBalancer acting as the proxy and would access Couchbase UI securely, with SSL using DNS SRV records. Since we are in a test environment, we will access the Couchbase UI directly from Port 8091. We do need one more step to achieve this and that is Port Forwarding.
Port Forwarding
|
1 2 3 4 |
cao-2 $ kubectl port-forward cb-example-0000 8091 & [1] 11375 cao-2 $ Forwarding from 127.0.0.1:8091 -> 8091 Forwarding from [::1]:8091 -> 8091 |
We now have deployed three pods, however, it’s enough to port forward from one pod to access the Couchbase Admin UI.
Access the UI
https://localhost:8091
Create the buckets
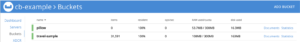
Add sample bucket and create pillow bucket
Run a workload to generate some metrics
We will use cbc-pillowfight to generate the workload. Luckily, this is bundled along with the Operator and lets deploy this. Let’s make a minor modification to the YAML file first, so that it doesn’t stop with loading the data but performs operations on the bucket. We will use the pillow bucket we just created.
|
1 2 3 4 5 6 7 8 9 10 11 12 13 14 15 16 |
apiVersion: batch/v1 kind: Job metadata: name: pillowfight spec: template: metadata: name: pillowfight spec: containers: - name: pillowfight image: sequoiatools/pillowfight:v5.0.1 command: ["cbc-pillowfight", "-U", "couchbase://cb-example-0000.cb-example.default.svc/pillow?select_bucket=true", "-I", "10000", "-B", "1000", "-c", "10000", "-t", "1", "-u", "Administrator", "-P", "password"] restartPolicy: Never |
Change the bucket from default to pillow and changed the -c (number of loops) option from 10 to 10,000.
Then:
|
1 2 |
cao-2 $ kubectl create -f pillowfight-data-loader.yaml job.batch/pillowfight created |
Testing Prometheus and Grafana locally
We now have a three node Couchbase Cluster with the Prometheus Couchbase Exporter. The Exporter is scraping Couchbase metrics to Port 9091. Now, we could forward that port just like we forwarded port 8091 to access the Couchbase Web Console UI from our desktop. With that forwarded port, we could then have Prometheus and Grafana running in Docker containers on the desktop and use the forwarded 9091 port to get the metrics into Prometheus and visualize it in Grafana.
With the above approach, there is a limitation. First is, we would have to forward port 9091 from all 3 nodes and those node names would be hardcoded. Hardcoding node names is a huge problem in a Kubernetes environment. Moreover, you would really not be doing port forwarding in a Production environment, where you would be typically deploying with DNS and would use the DNS SRV to connect to the cluster. Finally, its best practice to run Prometheus and Grafana in Kubernetes itself, aligning with the Cloud Native paradigm.
Next Steps
In Part 2, we will be doing just that, apart from DNS since we still want to keep this as simple as possible for quick testing.
Resources:
- Download Couchbase Autonomous Operator 2.0 Beta for Kubernetes
- Getting started Couchbase Autonomous Operator 2.0 Beta
- Tutorial – Couchbase Autonomous Operator on EKS
- Share your thoughts on the Couchbase Forums
Thanks Prasad for sharing. May I ask what are the key metrics to monitor to decide when to scale-out the cluster and is it possible to configure auto-scaling of couchbase cluster in K8s?
Regards