Couchbase 블로그의 이전 게시물을 팔로우하고 계신다면 다음을 보셨을 것입니다. 카우치베이스 셸에 대한 콘텐츠 최신 릴리스입니다. 저는 다양한 시도를 하고 있는데, 오늘은 시계열 데이터 집합으로 무엇을 할 수 있는지 알아보고 싶었습니다.
시계열 데이터 수집
Kaggle을 검색하면서 다음을 발견했습니다. 도시별 온도 데이터. 다운로드했습니다. 용량이 500Mb 정도라서 전체적으로 조작하기는 어렵습니다. 하지만 물론 텍스트 파일이기 때문에 데이터 구조를 쉽게 들여다볼 수 있습니다:
|
1 2 3 4 5 6 7 8 9 10 11 12 13 14 15 16 |
> open GlobalLandTemperaturesByCity.csv | first 10 ╭───┬────────────┬────────────────────┬───────────────────────────────┬───────┬─────────┬──────────┬───────────╮ │ # │ dt │ AverageTemperature │ AverageTemperatureUncertainty │ City │ Country │ Latitude │ Longitude │ ├───┼────────────┼────────────────────┼───────────────────────────────┼───────┼─────────┼──────────┼───────────┤ │ 0 │ 1743-11-01 │ 6.07 │ 1.74 │ Århus │ Denmark │ 57.05N │ 10.33E │ │ 1 │ 1743-12-01 │ │ │ Århus │ Denmark │ 57.05N │ 10.33E │ │ 2 │ 1744-01-01 │ │ │ Århus │ Denmark │ 57.05N │ 10.33E │ │ 3 │ 1744-02-01 │ │ │ Århus │ Denmark │ 57.05N │ 10.33E │ │ 4 │ 1744-03-01 │ │ │ Århus │ Denmark │ 57.05N │ 10.33E │ │ 5 │ 1744-04-01 │ 5.79 │ 3.62 │ Århus │ Denmark │ 57.05N │ 10.33E │ │ 6 │ 1744-05-01 │ 10.64 │ 1.28 │ Århus │ Denmark │ 57.05N │ 10.33E │ │ 7 │ 1744-06-01 │ 14.05 │ 1.35 │ Århus │ Denmark │ 57.05N │ 10.33E │ │ 8 │ 1744-07-01 │ 16.08 │ 1.40 │ Århus │ Denmark │ 57.05N │ 10.33E │ │ 9 │ 1744-08-01 │ │ │ Århus │ Denmark │ 57.05N │ 10.33E │ ╰───┴────────────┴────────────────────┴───────────────────────────────┴───────┴─────────┴──────────┴───────────╯ |
|
1 2 3 |
> open GlobalLandTemperaturesByCity.csv | length 8599212 |
8599212 줄, 이것은 8599211 문서가 될 것입니다. 제 최종 목표는 여러 도시의 수년간의 기온 그래프를 보는 것입니다. 이를 위해 먼저 모든 것을 가져오기 버킷으로 가져온 다음 데이터를 시계열로 변환하겠습니다.
이것을 순진하게 가져오면 도시/월별 그룹당 하나의 문서가 제공됩니다. 따라서 내 문서의 키는 다음과 같습니다. Århus:1743-11-01. 첫 번째 줄만 업로드하고 싶다고 가정하면 다음과 같이 표시되어야 합니다:
|
1 2 3 4 5 6 7 8 9 10 11 12 13 14 15 |
> open GlobalLandTemperaturesByCity.csv | first 1 | wrap content | insert id { |x| $"($x.content.City):($x.content.dt)" } ╭───┬───────────────────┬──────────────────╮ │ # │ content │ id │ ├───┼───────────────────┼──────────────────┤ │ 0 │ {record 7 fields} │ Århus:1743-11-01 │ ╰───┴───────────────────┴──────────────────╯ > open GlobalLandTemperaturesByCity.csv | first 1 | wrap content | insert id { |x| $"($x.content.City):($x.content.dt)" } |doc upsert ╭───┬───────────┬─────────┬────────┬──────────┬─────────╮ │ # │ processed │ success │ failed │ failures │ cluster │ ├───┼───────────┼─────────┼────────┼──────────┼─────────┤ │ 0 │ 1 │ 1 │ 0 │ │ capella │ ╰───┴───────────┴─────────┴────────┴──────────┴─────────╯ |
이제 작동한다는 것을 알았으니 모든 것을 가져와서 일괄 처리해 보겠습니다:
|
1 |
open GlobalLandTemperaturesByCity.csv | par-each -t 5 {|x| wrap content | insert id {$"($x.City):($x.dt)" } } | doc upsert |
나는 시리즈 컬렉션의 결과를 가져오는 선택 집계, 타임스탬프로 모든 날짜 및 모든 평균 온도 를 값으로 설정합니다:
|
1 2 3 4 5 6 7 8 9 10 11 12 13 14 15 16 17 18 19 20 21 22 |
query ' INSERT INTO series(KEY _k, VALUE _v) SELECT a.City _k, {"City": a.City , "ts_start" : MIN(STR_TO_MILLIS(a.dt)), "ts_end" : MAX(STR_TO_MILLIS(a.dt)), "ts_data" : ARRAY_AGG([STR_TO_MILLIS(a.dt), a.AverageTemperature]) } _v FROM import a WHERE a.dt BETWEEN "1700-01-01" AND "2020-12-31" GROUP BY a.City; ' INSERT INTO series(KEY _k, VALUE _v) SELECT a.City _k, {"City": a.City , "ts_start" : MIN(STR_TO_MILLIS(a.dt)), "ts_end" : MAX(STR_TO_MILLIS(a.dt)), "ts_data" : ARRAY_AGG([STR_TO_MILLIS(a.dt), a.AverageTemperature]) } _v FROM import a WHERE SUBSTR(a.City,0,1) = "Z" AND a.dt BETWEEN "2010-01-01" AND "2020-12-31" GROUP BY a.City; |
이제 모든 데이터를 시계열로 사용할 수 있습니다. 파리의 데이터를 원한다고 가정하면 _timeseries 함수는 다음과 같습니다:
|
1 2 3 4 5 6 7 8 9 10 11 12 13 14 |
> let ts_ranges = [946684800000,1375315200000]; query $"SELECT t._t time, t._v0 `value` FROM series AS d UNNEST _timeseries\(d, {\"ts_ranges\":($ts_ranges)}\) AS t WHERE d.city = \"Paris\" AND \(d.ts_start <= ($ts_ranges.1) AND d.ts_end >= ($ts_ranges.0) \);" | reject cluster | to csv time,value 946684800000,3.845 949363200000,6.587000000000001 951868800000,7.872000000000001 954547200000,10.067 957139200000,15.451 959817600000,17.666 962409600000,16.954 965088000000,19.512 967766400000,16.548000000000002 970358400000,11.675999999999998 .... |
작업 속도를 높이려면 다음 색인을 만들 수 있습니다: 시리즈(City, ts_end, ts_start)에 인덱스 ix1을 생성합니다;
사용법에 유의하세요. ts_ranges 변수를 추가하세요. 템플릿에서 이러한 값을 쉽게 재사용할 수 있습니다. 문자열. 로 시작하여 $ 기호와 변수는 다음과 같이 괄호 안에 넣어야 합니다. ($my_변수). 또한 이제 큰따옴표뿐만 아니라 괄호 문자도 이스케이프 처리해야 한다는 의미이기도 합니다.
시계열 플롯
다양한 터미널 플로팅 라이브러리가 있으며, 여기서는 다음을 사용하고 있습니다. 유플롯:
|
1 |
> let ts_ranges = [946684800000,1375315200000]; query $"SELECT t._t date, t._v0 `value` FROM series AS d UNNEST _timeseries\(d, {\"ts_ranges\":($ts_ranges)}\) AS t WHERE d.city = \"Paris\" AND \(d.ts_start <= ($ts_ranges.1) AND d.ts_end >= ($ts_ranges.0) \);" | reject cluster | to csv | uplot line -d, --xlim 946684800000,1375315200000 --ylim -20,35 --title "global temperature in Paris" --xlabel date --ylabel temperature` |
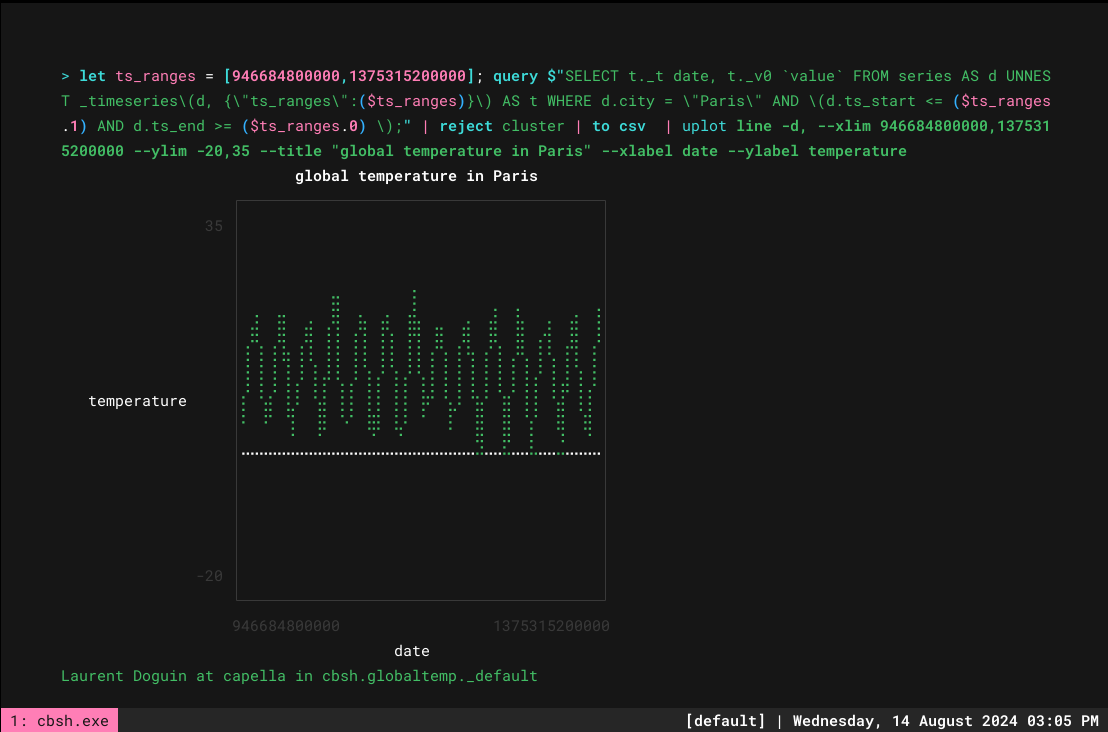
이제 모두 훌륭하지만 이상적으로는 여러 도시를 비교하기 위해 거기에 여러 도시를 포함시키고 싶습니다. 추가 CSV 열은 다음을 실행하면 자동으로 선택됩니다. 유플롯 라인. 점진적으로 작업을 수행하면서 쿼리에서 여러 도시를 지원하는 것부터 시작해 보겠습니다. 여기서 몇 가지 변경 사항이 있습니다:
-
- 시간별로 데이터 그룹화
- 추가 d.city IN ($city) 를 where 절에 추가합니다. 이는 도시 배열이 JSON 배열의 문자열 리터럴이기 때문에 작동합니다. 답을 JSON 문서로 살펴보겠습니다:
|
1 2 3 4 5 6 7 8 9 10 11 12 13 14 15 16 17 18 19 20 21 22 23 24 25 26 |
> let ts_ranges = [946684800000,1375315200000]; let city = ['"Aba"','"Berlin"','"London"','"Paris"']; query $"SELECT t._t date, \( ARRAY_AGG\({\"city\": d.city, \"temp\":t._v0}\) \) FROM series AS d UNNEST _timeseries\(d, {\"ts_ranges\":($ts_ranges)}\) AS t WHERE d.city IN ($city) AND \(d.ts_start <= ($ts_ranges.1) AND d.ts_end >= ($ts_ranges.0) \) GROUP BY t._t ORDER BY t._t;" | reject cluster | first |to json [ { "date": "2000-01-01", "$1": [ { "city": "Aba", "temp": 26.985000000000007 }, { "city": "Berlin", "temp": 1.3239999999999998 }, { "city": "London", "temp": 4.6930000000000005 }, { "city": "Paris", "temp": 3.845 } ] } ] |
하지만 이렇게 모든 것을 평평하게 만들어도 CSV로 변환할 수는 없습니다:
|
1 2 3 4 5 6 7 |
> let ts_ranges = [946684800000,1375315200000]; let city = ['"Aba"','"Berlin"','"London"','"Paris"']; query $"SELECT t._t date, \( ARRAY_AGG\({\"city\": d.city, \"temp\":t._v0}\) \) FROM series AS d UNNEST _timeseries\(d, {\"ts_ranges\":($ts_ranges)}\) AS t WHERE d.city IN ($city) AND \(d.ts_start <= ($ts_ranges.1) AND d.ts_end >= ($ts_ranges.0) \) GROUP BY t._t ORDER BY t._t;" |reject cluster | first |flatten|flatten|to csv date,city,temp 2000-01-01,Aba,26.985000000000007 2000-01-01,Berlin,1.3239999999999998 2000-01-01,London,4.6930000000000005 2000-01-01,Paris,3.845 |
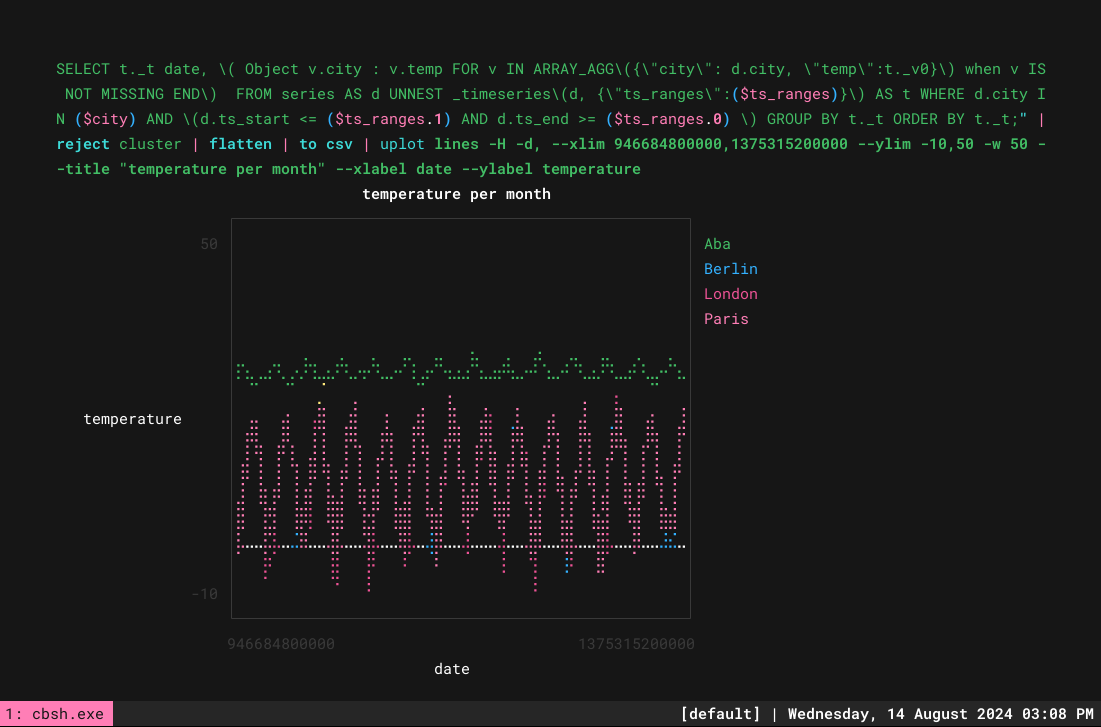
따라서 다음과 같이 객체로 변환할 수 있습니다: Object v.city : v.temp FOR v IN ARRAY_AGG({"city": d.city,"temp":t._v0}) 때 v가 누락되지 않은 경우 END
|
1 2 3 4 5 6 7 8 9 10 11 12 |
> let ts_ranges = [946684800000,1375315200000]; let city = ['"Aba"','"Berlin"','"London"','"Paris"']; query $"SELECT t._t date, \( Object v.city : v.temp FOR v IN ARRAY_AGG\({\"city\": d.city, \"temp\":t._v0}\) when v IS NOT MISSING END\) FROM series AS d UNNEST _timeseries\(d, {\"ts_ranges\":($ts_ranges)}\) AS t WHERE d.city IN ($city) AND \(d.ts_start <= ($ts_ranges.1) AND d.ts_end >= ($ts_ranges.0) \) GROUP BY t._t ORDER BY t._t;" |reject cluster | first | to json { "date": "2000-01-01", "$1": { "Aba": 26.985000000000007, "Berlin": 1.3239999999999998, "London": 4.6930000000000005, "Paris": 3.845 } } |
이제 이를 CSV로 평활화할 수 있습니다:
|
1 2 3 4 5 |
> let ts_ranges = [946684800000,1375315200000]; let city = ['"Aba"','"Berlin"','"London"','"Paris"']; query $"SELECT t._t date, \( Object v.city : v.temp FOR v IN ARRAY_AGG\({\"city\": d.city, \"temp\":t._v0}\) when v IS NOT MISSING END\) FROM series AS d UNNEST _timeseries\(d, {\"ts_ranges\":($ts_ranges)}\) AS t WHERE d.city IN ($city) AND \(d.ts_start <= ($ts_ranges.1) AND d.ts_end >= ($ts_ranges.0) \) GROUP BY t._t ORDER BY t._t;" |reject cluster | first | flatten| to csv date,Aba,Berlin,London,Paris 2000-01-01,26.985000000000007,1.3239999999999998,4.6930000000000005,3.845 |
이제 여러 줄을 그릴 준비가 되었습니다:
|
1 |
> let ts_ranges = [946684800000,1375315200000]; let city = ['"Aba"','"Berlin"','"London"','"Paris"']; query $"SELECT t._t date, \( Object v.city : v.temp FOR v IN ARRAY_AGG\({\"city\": d.city, \"temp\":t._v0}\) when v IS NOT MISSING END\) FROM series AS d UNNEST _timeseries\(d, {\"ts_ranges\":($ts_ranges)}\) AS t WHERE d.city IN ($city) AND \(d.ts_start <= ($ts_ranges.1) AND d.ts_end >= ($ts_ranges.0) \) GROUP BY t._t ORDER BY t._t;" |reject cluster | flatten | to csv | uplot lines -H -d, --xlim 946684800000,1375315200000 --ylim -10,50 -w 50 --title "temperature per month" --xlabel date --ylabel temperature |
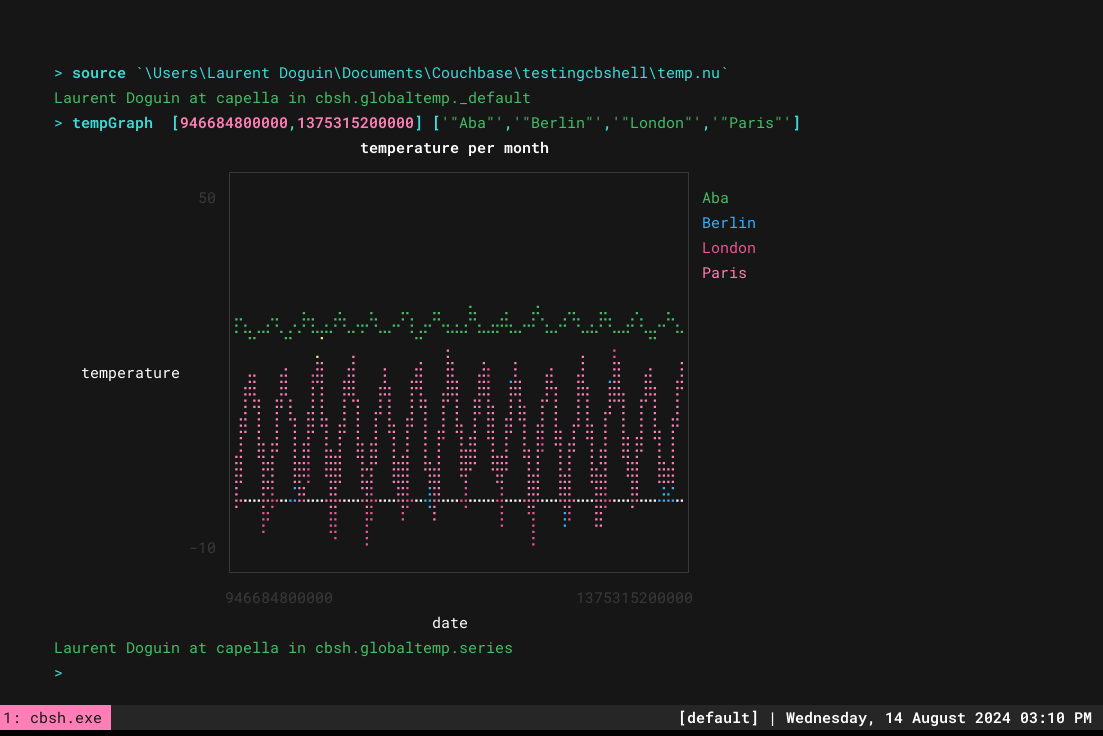
이 작업을 더 쉽게 하기 위해 함수를 사용할 수 있습니다. 함수를 만들어 .nu 파일과 같은 temp.nu에 다음과 같은 내용으로 업데이트합니다:
|
1 2 3 4 5 6 7 8 9 10 11 12 13 |
def tempGraph [$ts_ranges, $cities] { cb-env bucket cbsh cb-env scope globaltemp cb-env collection series let query = ($"SELECT t._t date, \( Object v.city : v.temp FOR v IN ARRAY_AGG\({\"city\": d.city, \"temp\":t._v0}\) when v IS NOT MISSING END\)" + $" FROM series AS d UNNEST _timeseries\(d, {\"ts_ranges\":($ts_ranges)}\) AS t " + $" WHERE d.city IN ($city) " + $" AND \(d.ts_start <= ($ts_ranges.1) AND d.ts_end >= ($ts_ranges.0) \)" + $" GROUP BY t._t ORDER BY t._t;" ) let csv = query $query |reject cluster | flatten | to csv $csv | uplot lines -H -d, --xlim 946684800000,1375315200000 --ylim -10,50 -w 50 --title "temperature per month" --xlabel date --ylabel temperature } |
그런 다음 소스를 제공하면 훨씬 더 쉽게 사용할 수 있습니다:
|
1 2 3 |
> source ./testingcbshell/temp.nu > tempGraph [946684800000,1375315200000] ['"Aba"','"Berlin"','"London"','"Paris"'] |
이 글을 통해 Couchbase 시계열 지원, Couchbase Shell 데이터 조작, 그리고 다음과 같은 다른 셸 명령을 사용하는 방법에 대한 간략한 개요를 얻으셨기를 바랍니다. 유플롯 를 사용하여 더욱 통합적이고 흥미롭게 만들 수 있습니다. 다음에서 다양한 형식의 전체 보고서를 쉽게 생성할 수 있습니다. GitHub 작업 예를 들어, 무한한 가능성!
-
- 다음에 대한 더 많은 게시물 읽기 카우치베이스 셸.