

If you have been following the earlier posts on the Couchbase blog, you have seen content about Couchbase Shell latest release. I am trying different things and today I wanted to see what I could do with time series datasets.
Ingest time series data
Browsing Kaggle, I found temperature data per City. I have downloaded it. It’s about 500Mb and that makes it hard to manipulate as a whole. But, of course, it’s a text file so we can easily peek at the data structure like so:
|
1 2 3 4 5 6 7 8 9 10 11 12 13 14 15 16 |
> open GlobalLandTemperaturesByCity.csv | first 10 ╭───┬────────────┬────────────────────┬───────────────────────────────┬───────┬─────────┬──────────┬───────────╮ │ # │ dt │ AverageTemperature │ AverageTemperatureUncertainty │ City │ Country │ Latitude │ Longitude │ ├───┼────────────┼────────────────────┼───────────────────────────────┼───────┼─────────┼──────────┼───────────┤ │ 0 │ 1743–11–01 │ 6.07 │ 1.74 │ Århus │ Denmark │ 57.05N │ 10.33E │ │ 1 │ 1743–12–01 │ │ │ Århus │ Denmark │ 57.05N │ 10.33E │ │ 2 │ 1744–01–01 │ │ │ Århus │ Denmark │ 57.05N │ 10.33E │ │ 3 │ 1744–02–01 │ │ │ Århus │ Denmark │ 57.05N │ 10.33E │ │ 4 │ 1744–03–01 │ │ │ Århus │ Denmark │ 57.05N │ 10.33E │ │ 5 │ 1744–04–01 │ 5.79 │ 3.62 │ Århus │ Denmark │ 57.05N │ 10.33E │ │ 6 │ 1744–05–01 │ 10.64 │ 1.28 │ Århus │ Denmark │ 57.05N │ 10.33E │ │ 7 │ 1744–06–01 │ 14.05 │ 1.35 │ Århus │ Denmark │ 57.05N │ 10.33E │ │ 8 │ 1744–07–01 │ 16.08 │ 1.40 │ Århus │ Denmark │ 57.05N │ 10.33E │ │ 9 │ 1744–08–01 │ │ │ Århus │ Denmark │ 57.05N │ 10.33E │ ╰───┴────────────┴────────────────────┴───────────────────────────────┴───────┴─────────┴──────────┴───────────╯ |
|
1 2 3 |
> open GlobalLandTemperaturesByCity.csv | length 8599212 |
8599212 lines, this is going to be 8599211 documents. My end goal is to see a temperature graph of several cities over the years. To do that, I am going to import everything to an import bucket first, then I will transform the data into time series.
If I import this naïvely, it gives me one doc per city/month group. So the key of my doc will be like Århus:1743-11-01. Say I only want to upload the first line, it should look like this:
|
1 2 3 4 5 6 7 8 9 10 11 12 13 14 15 |
> open GlobalLandTemperaturesByCity.csv | first 1 | wrap conteúdo | inserir identidade { |x| $“($x.content.City):($x.content.dt)” } ╭───┬───────────────────┬──────────────────╮ │ # │ content │ id │ ├───┼───────────────────┼──────────────────┤ │ 0 │ {gravar 7 campos} │ Århus:1743–11–01 │ ╰───┴───────────────────┴──────────────────╯ > open GlobalLandTemperaturesByCity.csv | first 1 | wrap conteúdo | inserir identidade { |x| $“($x.content.City):($x.content.dt)” } |doc atualização upsert ╭───┬───────────┬─────────┬────────┬──────────┬─────────╮ │ # │ processed │ success │ failed │ failures │ cluster │ ├───┼───────────┼─────────┼────────┼──────────┼─────────┤ │ 0 │ 1 │ 1 │ 0 │ │ Capela │ ╰───┴───────────┴─────────┴────────┴──────────┴─────────╯ |
And now that I know it works, let’s get everything, and batch it:
|
1 |
open GlobalLandTemperaturesByCity.csv | par–each –t 5 {|x| wrap conteúdo | inserir identidade {$“($x.City):($x.dt)” } } | doc atualização upsert |
I have created a series collection in which I import the result of a SELECIONAR aggregation, getting all the dates as timestamps and all the AverageTemperature as value:
|
1 2 3 4 5 6 7 8 9 10 11 12 13 14 15 16 17 18 19 20 21 22 |
consulta ‘ INSERT INTO series(KEY _k, VALUE _v) SELECT a.City _k, {“City”: a.City , “ts_start” : MIN(STR_TO_MILLIS(a.dt)), “ts_end” : MAX(STR_TO_MILLIS(a.dt)), “ts_data” : ARRAY_AGG([STR_TO_MILLIS(a.dt), a.AverageTemperature]) } _v FROM import a WHERE a.dt BETWEEN “1700-01-01” AND “2020-12-31” GROUP BY a.City; ‘ INSERT INTO series(KEY _k, VALUE _v) SELECIONAR a.City _k, {“City”: a.City , “ts_start” : MIN(STR_TO_MILLIS(a.dt)), “ts_end” : MAX(STR_TO_MILLIS(a.dt)), “ts_data” : ARRAY_AGG([STR_TO_MILLIS(a.dt), a.AverageTemperature]) } _v DE importar a ONDE SUBSTR(a.City,0,1) = “Z” E a.dt BETWEEN “2010-01-01” E “2020-12-31” GROUP POR a.City; |
And now all the data is available as time series. Say I want the data from Paris, I can use the _timeseries function like this:
|
1 2 3 4 5 6 7 8 9 10 11 12 13 14 |
> deixar ts_ranges = [946684800000,1375315200000]; consulta $“SELECT t._t time, t._v0 `value` FROM series AS d UNNEST _timeseries(d, {“ts_ranges“:($ts_ranges)}) AS t WHERE d.city = “Paris” AND (d.ts_start <= ($ts_ranges.1) AND d.ts_end >= ($ts_ranges.0) );” | reject aglomerado | para csv tempo,value 946684800000,3.845 949363200000,6.587000000000001 951868800000,7.872000000000001 954547200000,10.067 957139200000,15.451 959817600000,17.666 962409600000,16.954 965088000000,19.512 967766400000,16.548000000000002 970358400000,11.675999999999998 .... |
To speed things up you can create the following index: CREATE INDEX ix1 ON series(City, ts_end, ts_start);
Notice the use of the ts_ranges variable at the beginning. You can easily reuse those values in a template String. They start with a $ sign and variables must be in parenthesis like ($my_variable). Which also means that now you need to escape parenthesis character as well as double quotes.
Plot time series
There are a variety of terminal plotting libraries, here I am using youplot:
|
1 |
> deixar ts_ranges = [946684800000,1375315200000]; consulta $“SELECT t._t date, t._v0 `value` FROM series AS d UNNEST _timeseries(d, {“ts_ranges“:($ts_ranges)}) AS t WHERE d.city = “Paris” AND (d.ts_start <= ($ts_ranges.1) AND d.ts_end >= ($ts_ranges.0) );” | reject aglomerado | para csv | uplot linha –d, —xlim 946684800000,1375315200000 —ylim –20,35 —título “global temperature in Paris” —xlabel data —ylabel temperatura` |
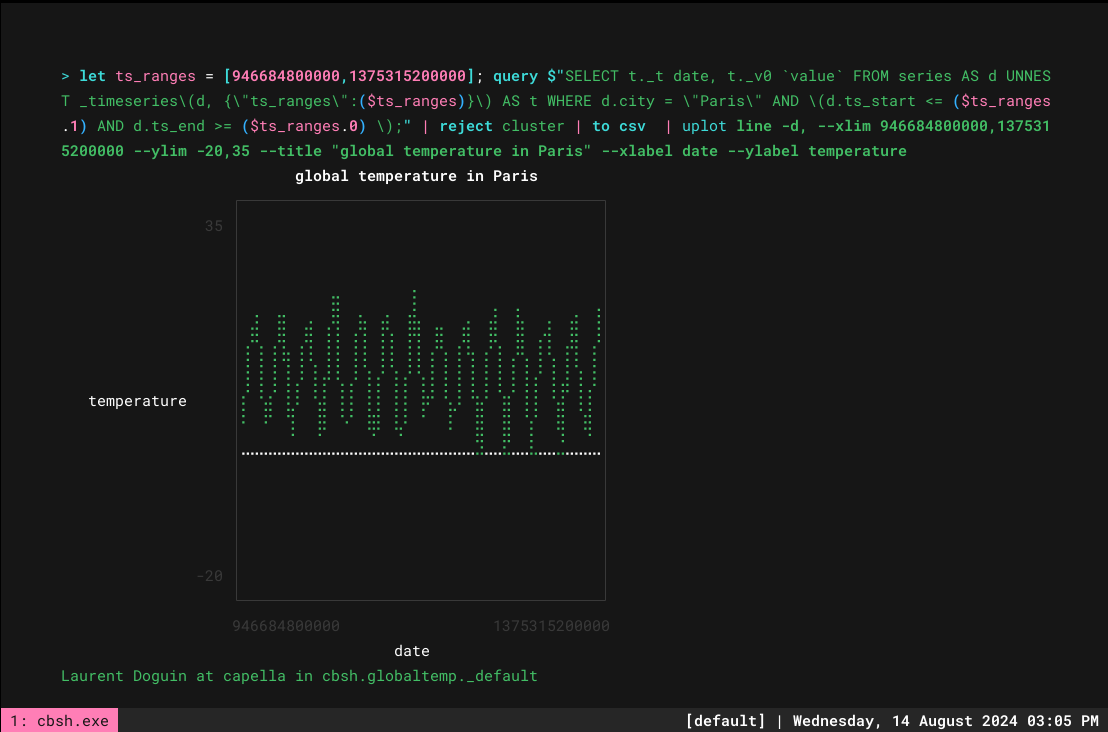
Now that is all great but ideally I want to have several cities in there to compare them. Any additional CSV columns are picked up automatically as long as you run youplot lines. Doing things gradually, let’s start with the support of multiple cities in the query. So a couple changes here:
- grouping the data by time
- adding d.city IN ($city) to the where clause. This works because the city array is a String literal of a JSON array. Let’s take a look at the answer as a JSON doc:
|
1 2 3 4 5 6 7 8 9 10 11 12 13 14 15 16 17 18 19 20 21 22 23 24 25 26 |
> deixar ts_ranges = [946684800000,1375315200000]; deixar cidade = [‘”Aba”‘,‘”Berlin”‘,‘”London”‘,‘”Paris”‘]; consulta $“SELECT t._t date, ( ARRAY_AGG({“cidade“: d.city, “temp“:t._v0}) ) FROM series AS d UNNEST _timeseries(d, {“ts_ranges“:($ts_ranges)}) AS t WHERE d.city IN ($city) AND (d.ts_start <= ($ts_ranges.1) AND d.ts_end >= ($ts_ranges.0) ) GROUP BY t._t ORDER BY t._t;” | reject aglomerado | first |para json [ { “date”: “2000-01-01”, “$1”: [ { “city”: “Aba”, “temp”: 26.985000000000007 }, { “city”: “Berlin”, “temp”: 1.3239999999999998 }, { “city”: “London”, “temp”: 4.6930000000000005 }, { “city”: “Paris”, “temp”: 3.845 } ] } ] |
But this cannot turn into a CSV, even if you flatten everything like this:
|
1 2 3 4 5 6 7 |
> deixar ts_ranges = [946684800000,1375315200000]; deixar cidade = [‘”Aba”‘,‘”Berlin”‘,‘”London”‘,‘”Paris”‘]; consulta $“SELECT t._t date, ( ARRAY_AGG({“cidade“: d.city, “temp“:t._v0}) ) FROM series AS d UNNEST _timeseries(d, {“ts_ranges“:($ts_ranges)}) AS t WHERE d.city IN ($city) AND (d.ts_start <= ($ts_ranges.1) AND d.ts_end >= ($ts_ranges.0) ) GROUP BY t._t ORDER BY t._t;” |reject aglomerado | first |flatten|flatten|para csv data,cidade,temp 2000–01–01,Aba,26.985000000000007 2000–01–01,Berlin,1.3239999999999998 2000–01–01,London,4.6930000000000005 2000–01–01,Paris,3.845 |
So we can transform it into an object like so: Object v.city : v.temp FOR v IN ARRAY_AGG({"city": d.city, "temp":t._v0}) when v IS NOT MISSING END
|
1 2 3 4 5 6 7 8 9 10 11 12 |
> deixar ts_ranges = [946684800000,1375315200000]; deixar cidade = [‘”Aba”‘,‘”Berlin”‘,‘”London”‘,‘”Paris”‘]; consulta $“SELECT t._t date, ( Object v.city : v.temp FOR v IN ARRAY_AGG({“cidade“: d.city, “temp“:t._v0}) when v IS NOT MISSING END) FROM series AS d UNNEST _timeseries(d, {“ts_ranges“:($ts_ranges)}) AS t WHERE d.city IN ($city) AND (d.ts_start <= ($ts_ranges.1) AND d.ts_end >= ($ts_ranges.0) ) GROUP BY t._t ORDER BY t._t;” |reject aglomerado | first | para json { “date”: “2000-01-01”, “$1”: { “Aba”: 26.985000000000007, “Berlin”: 1.3239999999999998, “London”: 4.6930000000000005, “Paris”: 3.845 } } |
Which can now be flatten into a CSV:
0
And with that we are ready to plot several lines:
1
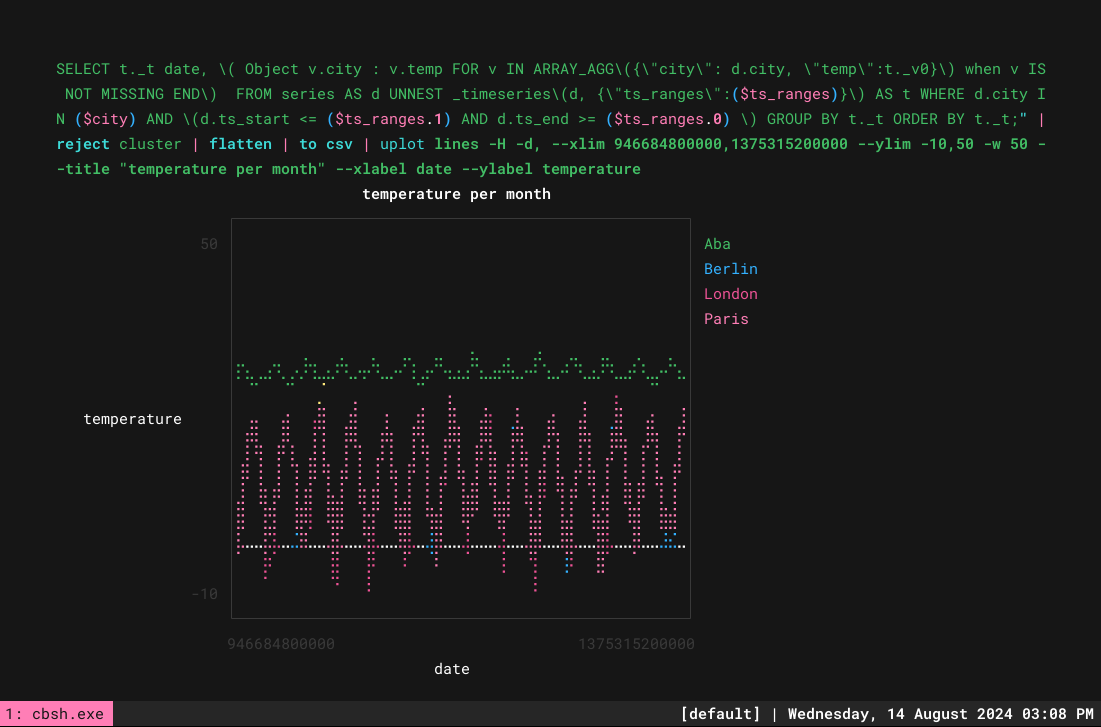
To make that easier, you can use functions. Create a .nu file, like temp.nu, with the following content:
2
Then if you source it it becomes much easier to use:
3
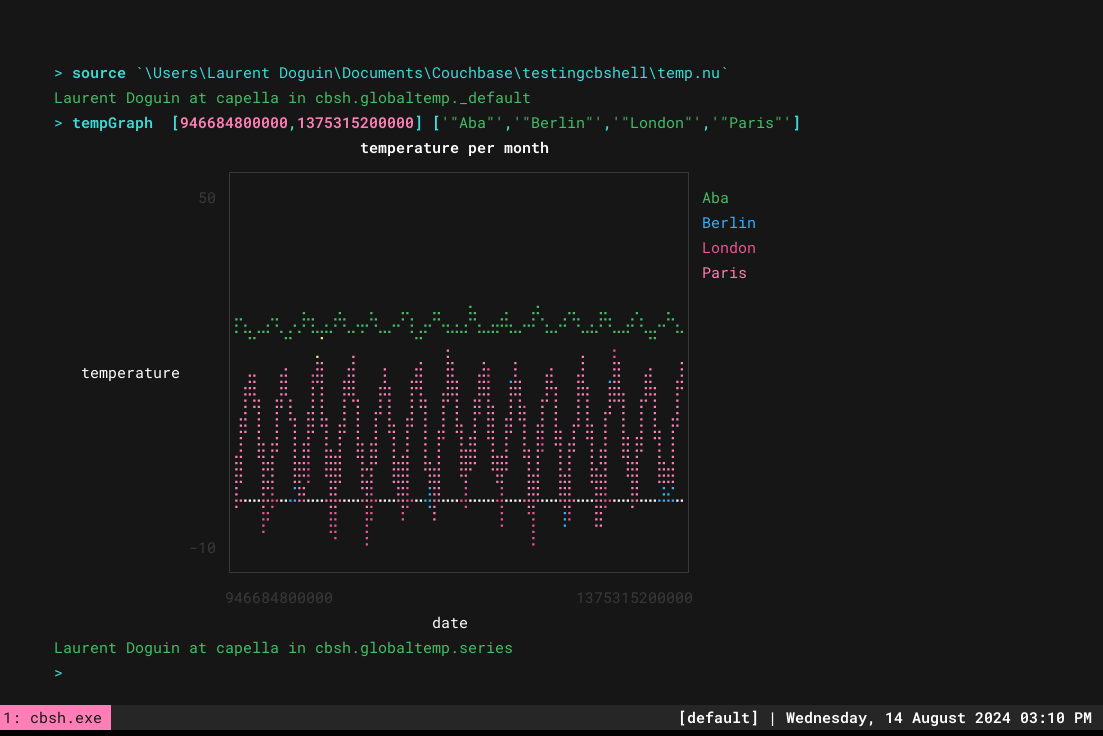
I hope this gave you a quick overview of Couchbase time series support, of Couchbase Shell data manipulation, and how you can use other shell commands like youplot to make things more integrated and interesting. You could easily generate a full report in various formats from a GitHub Actions for instance, endless possibilities!
- Read more posts about Shell do Couchbase.

Deixe um comentário
Você precisa fazer o login para publicar um comentário.