
JMH (Java Microbenchmarking Harness) has become one of my invaluable tools to quantify (and ultimately justify) a performance optimization inside the Couchbase Java SDK and its related projects. Since I see many users and customers struggling with similar questions, I thought it might be a good idea to show you how you can use JMC (Java Mission Control) in combination with JMH to guide your profiling and JMC performance optimization testing decisions by using real data instead of wild guessing.
You can just read along and poke the source code on the side, but if you want to reproduce what I’m going to show you, you need a recent Oracle JDK (for JMH, I’m using 1.8.0_51). Also, I’m not going to show all minor details like how to import a project into your IDE or similar. If you struggle with the basics of Java performance profiling, this post is probably not for you right away.
The problem with most real applications and libraries is that there is no obvious low hanging fruit. If you find something, pat yourself on the back and go fix it, those chances are rare. Very often you need to make lots of small enhancements to get better results. In the Java SDK, we care about increasing throughput while minimizing latency as much as possible. Since both properties don’t particularly love each other, there are only a few things you can do that make both happier at the same time:
- Reduce the amount of CPU your application needs on computations
- Minimize contention and synchronization points
- Avoid object allocations to make the GC do less
In this example you’ll see number 3 (and one) in action. I’ve been running the following code in the core-io project:
If you’ve seen some of my talks, I always tell people that something like this is not a proper benchmark – so why do I do it here? The big difference is that when as a user you are benchmarking Couchbase as a whole, this is not a realistic workload that mimics your production system. As a library developer, I want to find hot code paths and make them faster, so running the same code over and over again exposes those paths better in the JVM (Java) profiler.
When I run this code against my local Couchbase Server node, I get around 9k ops/s. I’m not interested in increasing throuhgput at this point, I am trying to reduce object allocations on the hot code path in the first place. Starting up JMC and pointing it to my JVM through JFR (Java Flight Recorder) and then leaving the machine alone for 5 minutes while profiling yielded the following:
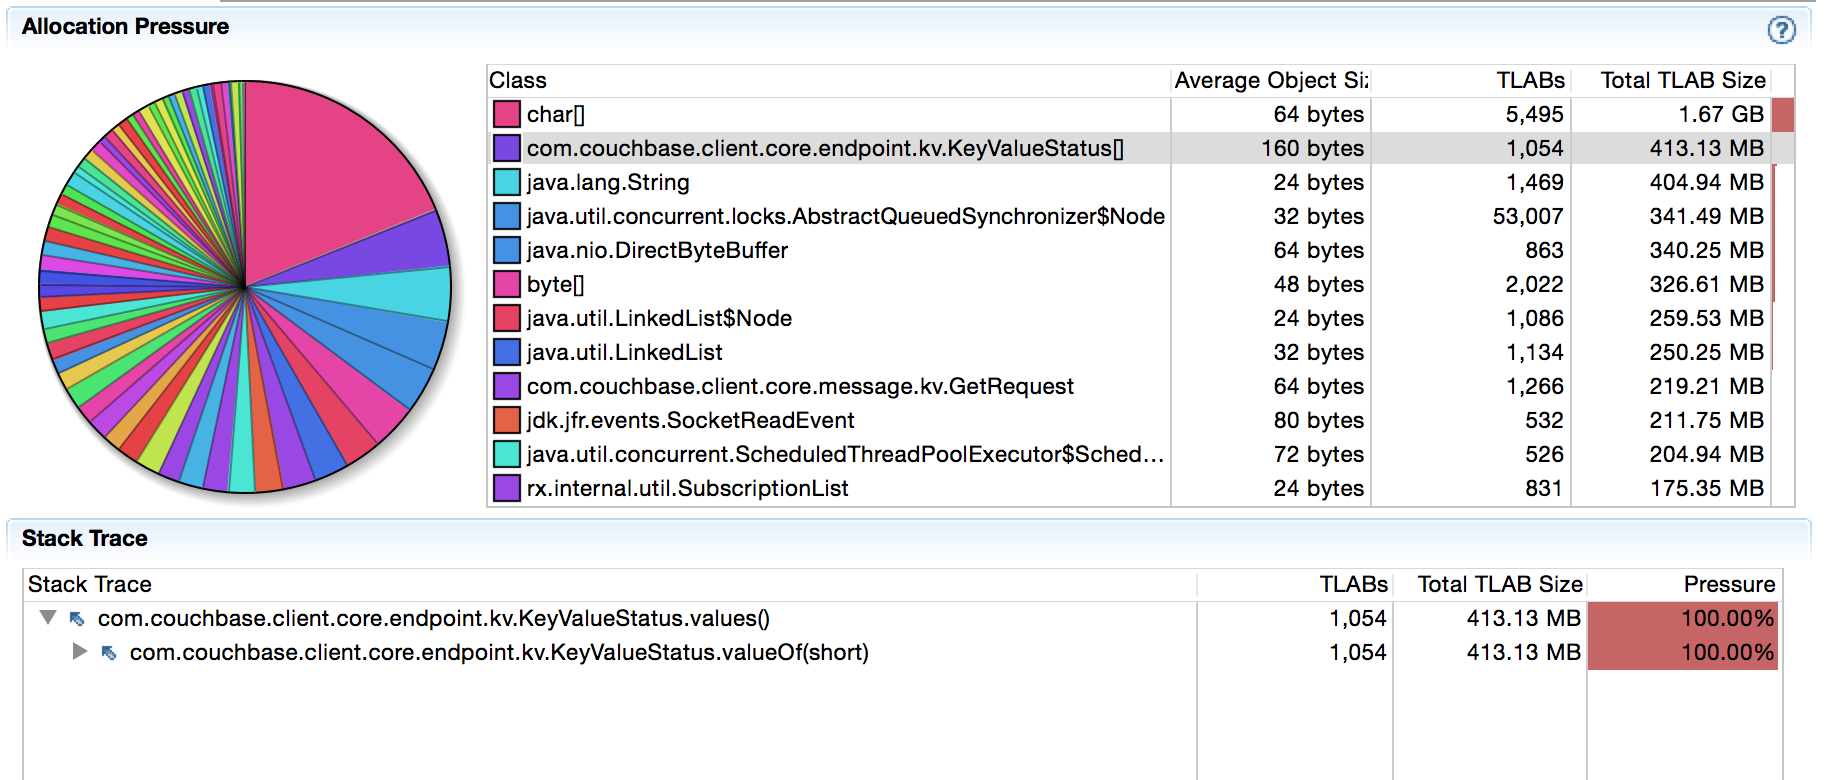
There are 400MB allocated over 5 minutes for KeyValueStatus[] objects. Now this might not be obvious to you, but I know we recently changed something in that codepath (see here) and I haven’t seen this particular type of allocations come up before. After a quick investigation it was clear that the suspect is on the following codepath (note how JFR guides us to the right place):
Every time a response arrives, we match it against the KeyValueStatus enum to set the proper response status. One of my colleagues made the code look nice during refactoring, but it also very subtly introduced GC overhead. As the profiling information shows, values() always creates an array so we can iterate over it and find the matching code. It’s not much, but it adds up over time. But most importantly: it’s unnecessary garbage.
As it turns out, some responses are (much) more likely to happen than others, so we can optimize for the common case (always a good idea). I’m not going to bore you with all the low level stuff, but in the GET case normally you’ll either get a SUCCESS if the document exists or a NOT_FOUND if the document does not exist. So one thing we can do is the following:
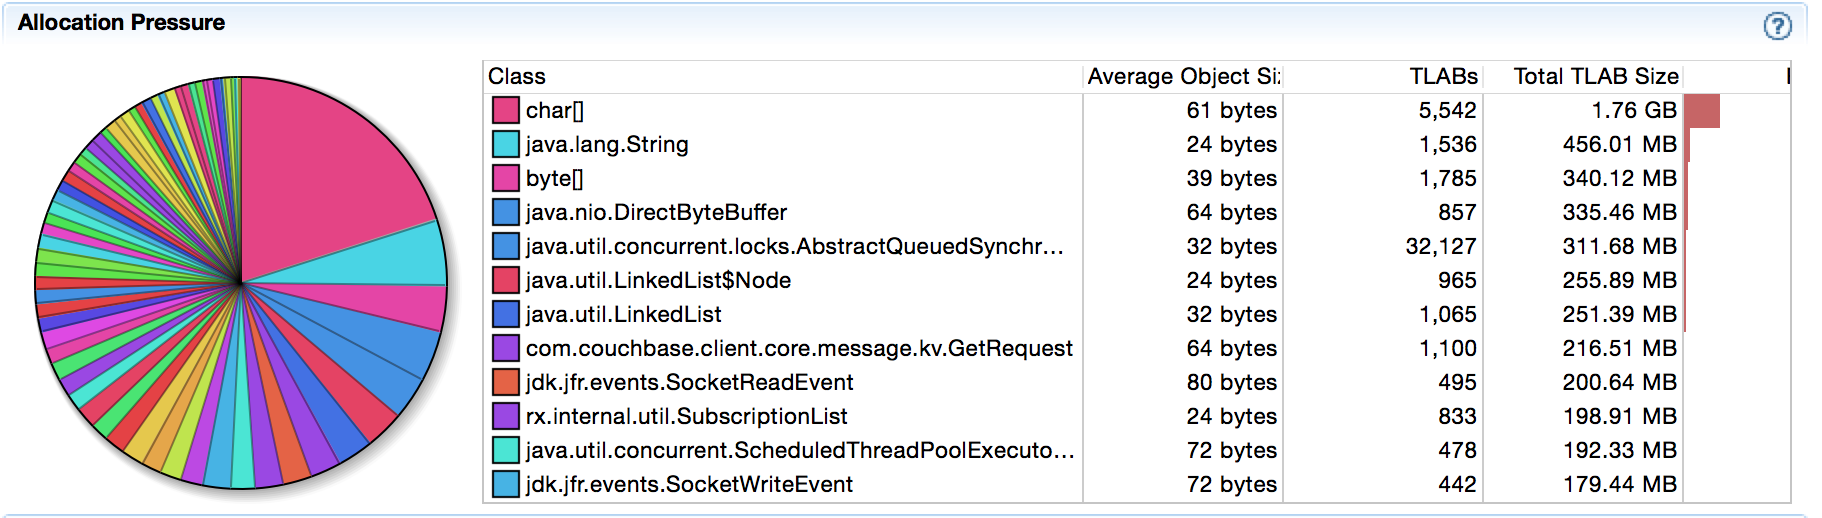
Changing the code and running the JFR again the array allocations are gone:
Most of the time developers tend to stop at this point, but I advocate you to read on. Just because we’ve avoided the array allocations (which is a good thing) doesn’t mean its faster, right? In general one would believe so, but I’ve been surprised too many times in the past to just believe it. Even if we are right, whipping up a quick JMH microbenchmark to find out is a good thing. It will also allow us to quantify any improvements for N°1 from above, not just N°3 which we’ve already checked.
JMH is part of the OpenJDK project and is not that hard to use. You can set up a project using the mvn archetype:generate command that you can find on its homepage. Once you have the skeleton project, you have two choices: either add the Java SDK as a dependency (it will be shadowed automatically) or just copy the enum over. Depending on how large your tests are and what you want to test, you want to pick one of the two. Since our current tests is self-contained, we can copy the ENUM over into the project. This has the benefit that we can modify it as we go, add new methods to try out things and thelike.
I’ve copied the KeyValueStatus class over from the 2.2.0 version and changed the code so we can call two variants at the same time:
Now we can write our (simple) JMH benchmark:
Next up we compile the code and run it on the command line. First run “mvn clean install” and then start it through “java -jar target/benchmarks.jar -wi 10 -f1 -i 10 -bm avgt -tu ns”.
If that is too arcane for you, it just means we want to measure average latency in nanoseconds and perform 10 warmup iterations as well as 10 measured iterations on one fork. Curious? Here are the results:
All operations are in the lower nanosecond range, so the JVM does a pretty good job of optimizing the loop – but it can’t beat the simple compare and return operations. Since the optimized code has a fallback, you can see on code 134 it falls back to the loop. What you can see in addition on the “original” runs is that it also matters where the elements are placed in the ENUM once you loop over it. 0 and 1 are pretty much at the top while 134 is at the bottom. So even reordering for the common case makes sense.
So by now we are pretty convinced it makes sense to implement that change. It reduces allocations and is faster to execute. In addition, it doesn’t make the code that more complex. In practice though, we need more codes on the optimized path, since those two don’t cut it. From the long enum list, they are:
- SUCCESS
- ERR_NOT_FOUND
- ERR_EXISTS
- ERR_NOT_MY_VBUCKET
- ERR_BUSY
- ERR_TOO_BIG
- ERR_TEMP_FAIL
So one final question remains to be answered: should we use if/elseif for them or a simple switch() block? Does it matter at all? One more JMH benchmark:
And here are the results:
We have now included all three params in our fast path code, so there is no outlier anymore. Also you can see there is no practical difference whatsoever for our use case. So both case and if/else work fine and can be picked based on preference and code clarity.
That’s it for today! Reducing object allocations and making code faster as a side effect by using tools like JMH and JFR for educated measurements instead of wild guessing. Happy hacking and no race conditions to you all.
Nice write up!
My first try would have been to just cache the result of values() as VALUES in the KeyValueStatus2 and, as a second step, reordering the enum values for the common case.
In my results this is just 1-2 ns behind your version for the common case, but it\’s a bit better for the edge case – perhaps an additional optimization candidate ;-)
Hey Thomas,
great idea – thanks for the feedback! I\’ll give it a shot – maybe also reordering them then by how often they show up in the field.
Nice! Any chance I could get the recording? :)