Recentemente, anunciamos a última prévia do Operador autônomo do Couchbase (CAO) 2.0 beta. Este lançamento é uma atualização significativa do Couchbase Autonomous Operator. O Couchbase Autonomous Operator 2.0 apresenta vários novos recursos de nível empresarial com recursos totalmente autônomos - segurança, monitoramento, alta disponibilidade e capacidade de gerenciamento. Neste blog, examinaremos em detalhes como um deles funciona.
Coleção de métricas da Prometheus
O operador mais recente oferece integração nativa com o Couchbase Prometheus Exporter para coletar e expor as métricas do Couchbase Server. Essas métricas exportadas podem ser extraídas pelo Prometheus e, em seguida, visualizadas em ferramentas como o Grafana.
Descreveremos as etapas para implantar o cluster com o Couchbase Prometheus Exporter e analisaremos algumas das métricas por meio do Grafana. Esta será uma implantação simples de teste de cluster único e não detalhará todas as outras etapas necessárias para uma implantação em nível de produção.
Estaremos acompanhando de perto o Tutorial do Couchbase Autonomous Operator 2.0 Beta sobre a instalação no Amazon EKS.
Pré-requisitos
Presumo que você já tenha um Nuvem privada virtual da Amazon (VPC) a ser usado. Siga a documentação sobre Primeiros passos com o Amazon EKS e instale o seguinte:
- kubectl
- aws-iam-authenticator
- eksctl
- Pares de chaves do Amazon EC2
- Operador autônomo do Couchbase 2.0 Beta
Arquitetura de implantação
Uma rápida visão geral da arquitetura de nossa implantação.
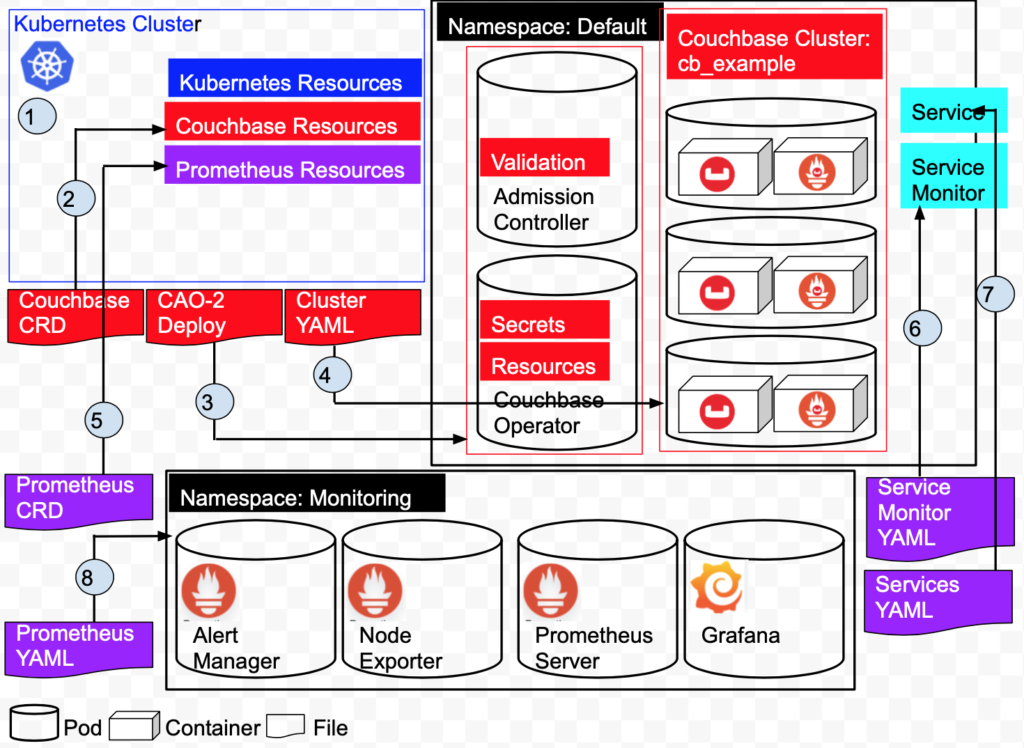
Com base no diagrama acima:
1: Crie o cluster do Kubernetes no Amazon EKS. O cluster gerencia os recursos e serviços do Kubernetes.
2: Adicione recursos do Couchbase instalando as definições de recursos personalizados do Couchbase.
3: Instale o Operador Autônomo do Couchbase. Isso cria dois pods, o Operator e o Admission Controller no namespace Default.
4: implante um cluster do Couchbase de 3 nós no namespace padrão. Isso cria 3 pods, cada pod tem um contêiner do Couchbase 6.5.0 e um contêiner do Couchbase Metrics Exporter.
5: Crie um ServiceMonitor que informe ao Prometheus para monitorar um recurso de serviço que define os pontos de extremidade que o Prometheus coleta.
6: Criar um serviço definirá a porta que descrevemos em nosso ServiceMonitor anteriormente no namespace Default.
7: Adicione recursos do Prometheus instalando as definições de recursos personalizados do Prometheus.
8: Crie os pods do Prometheus/Grafana no namespace Monitoring.
Criar o cluster e configurar o kubectl
|
1 2 3 4 5 6 7 8 9 10 11 12 13 14 15 16 17 18 19 20 21 22 23 24 25 26 27 28 29 30 31 32 33 34 35 36 37 38 39 40 41 42 43 44 |
$ eksctl create cluster \ --name prasadCAO2 \ --region us-east-1 \ --zones us-east-1a,us-east-1b,us-east-1c \ --nodegroup-name standard-workers \ --node-type t3.medium \ --nodes 3 \ --nodes-min 1 \ --nodes-max 4 \ --ssh-access \ --ssh-public-key ~/couchbase-prasad.pub \ --managed [ℹ] eksctl version 0.16.0 [ℹ] using region us-east-1 [ℹ] subnets for us-east-1a - public:192.168.0.0/19 private:192.168.96.0/19 [ℹ] subnets for us-east-1b - public:192.168.32.0/19 private:192.168.128.0/19 [ℹ] subnets for us-east-1c - public:192.168.64.0/19 private:192.168.160.0/19 [ℹ] using SSH public key "/Users/krishna.doddi/couchbase-prasad.pub" as "eksctl-prasadCAO2-nodegroup-standard-workers-42:57:cd:cb:28:33:4a:d9:59:4e:73:3b:c0:e8:a3:fe" [ℹ] using Kubernetes version 1.14 [ℹ] creating EKS cluster "prasadCAO2" in "us-east-1" region with managed nodes [ℹ] will create 2 separate CloudFormation stacks for cluster itself and the initial managed nodegroup [ℹ] if you encounter any issues, check CloudFormation console or try 'eksctl utils describe-stacks --region=us-east-1 --cluster=prasadCAO2' [ℹ] CloudWatch logging will not be enabled for cluster "prasadCAO2" in "us-east-1" [ℹ] you can enable it with 'eksctl utils update-cluster-logging --region=us-east-1 --cluster=prasadCAO2' [ℹ] Kubernetes API endpoint access will use default of {publicAccess=true, privateAccess=false} for cluster "prasadCAO2" in "us-east-1" [ℹ] 2 sequential tasks: { create cluster control plane "prasadCAO2", create managed nodegroup "standard-workers" } [ℹ] building cluster stack "eksctl-prasadCAO2-cluster" [ℹ] deploying stack "eksctl-prasadCAO2-cluster" [ℹ] building managed nodegroup stack "eksctl-prasadCAO2-nodegroup-standard-workers" [ℹ] deploying stack "eksctl-prasadCAO2-nodegroup-standard-workers" [✔] all EKS cluster resources for "prasadCAO2" have been created [✔] saved kubeconfig as "/Users/krishna.doddi/.kube/config" [ℹ] nodegroup "standard-workers" has 3 node(s) [ℹ] node "ip-192-168-13-207.ec2.internal" is ready [ℹ] node "ip-192-168-62-181.ec2.internal" is ready [ℹ] node "ip-192-168-93-184.ec2.internal" is ready [ℹ] waiting for at least 1 node(s) to become ready in "standard-workers" [ℹ] nodegroup "standard-workers" has 3 node(s) [ℹ] node "ip-192-168-13-207.ec2.internal" is ready [ℹ] node "ip-192-168-62-181.ec2.internal" is ready [ℹ] node "ip-192-168-93-184.ec2.internal" is ready [ℹ] kubectl command should work with "/Users/krishna.doddi/.kube/config", try 'kubectl get nodes' [✔] EKS cluster "prasadCAO2" in "us-east-1" region is ready |
|
1 2 3 4 5 6 7 8 9 10 11 12 |
$ kubectl get svc NAME TYPE CLUSTER-IP EXTERNAL-IP PORT(S) AGE kubernetes ClusterIP 10.100.0.1 <none> 443/TCP 15m $ kubectl get nodes NAME STATUS ROLES AGE VERSION ip-192-168-13-207.ec2.internal Ready <none> 4d4h v1.14.9-eks-1f0ca9 ip-192-168-62-181.ec2.internal Ready <none> 4d4h v1.14.9-eks-1f0ca9 ip-192-168-93-184.ec2.internal Ready <none> 4d4h v1.14.9-eks-1f0ca9 |
Configurar o kubectl
Esse comando é fundamental, pois define as variáveis relevantes do Amazon Resource Name (ARN) em ~/.kube/config. Opcionalmente, você pode adicionar --region regionName para especificar um cluster em uma região diferente da padrão. (Sua região padrão deve ter sido especificada quando você configurou a CLI do AWS pela primeira vez por meio de aws configurecomando).
|
1 2 3 |
$ aws eks update-kubeconfig --name prasadCAO2 Added new context arn:aws:eks:us-east-1:429712224361:cluster/prasadCAO2 to /Users/krishna.doddi/.kube/config |
Instalar as definições de recursos personalizados (CRD)
Observação: Fiz o download do Operator para MacOS, renomeei o pacote de couchbase-autonomous-operator-kubernetes_2.0.0-macos-x86_64 para cao-2 e cd'd nesse diretório.
A primeira etapa da instalação do Operator é instalar as definições de recursos personalizados (CRD) que descrevem os tipos de recursos do Couchbase.
|
1 2 3 4 5 6 7 8 9 10 11 12 |
cao-2 $ kubectl create -f crd.yaml customresourcedefinition.apiextensions.k8s.io/couchbasebuckets.couchbase.com created customresourcedefinition.apiextensions.k8s.io/couchbaseephemeralbuckets.couchbase.com created customresourcedefinition.apiextensions.k8s.io/couchbasememcachedbuckets.couchbase.com created customresourcedefinition.apiextensions.k8s.io/couchbasereplications.couchbase.com created customresourcedefinition.apiextensions.k8s.io/couchbaseusers.couchbase.com created customresourcedefinition.apiextensions.k8s.io/couchbasegroups.couchbase.com created customresourcedefinition.apiextensions.k8s.io/couchbaserolebindings.couchbase.com created customresourcedefinition.apiextensions.k8s.io/couchbaseclusters.couchbase.com created customresourcedefinition.apiextensions.k8s.io/couchbasebackups.couchbase.com created customresourcedefinition.apiextensions.k8s.io/couchbasebackuprestores.couchbase.com created |
Instale o Operador Autônomo 2.0
|
1 2 3 4 5 6 7 8 9 10 11 12 13 14 15 |
cao-2 $ bin/cbopcfg | kubectl create -f - serviceaccount/couchbase-operator-admission created clusterrole.rbac.authorization.k8s.io/couchbase-operator-admission created clusterrolebinding.rbac.authorization.k8s.io/couchbase-operator-admission created secret/couchbase-operator-admission created deployment.apps/couchbase-operator-admission created service/couchbase-operator-admission created mutatingwebhookconfiguration.admissionregistration.k8s.io/couchbase-operator-admission created validatingwebhookconfiguration.admissionregistration.k8s.io/couchbase-operator-admission created serviceaccount/couchbase-operator created role.rbac.authorization.k8s.io/couchbase-operator created rolebinding.rbac.authorization.k8s.io/couchbase-operator created deployment.apps/couchbase-operator created service/couchbase-operator created |
Verificar o status do Operador
|
1 2 3 4 5 |
cao-2 $ kubectl get deployments NAME READY UP-TO-DATE AVAILABLE AGE couchbase-operator 1/1 1 1 96s couchbase-operator-admission 1/1 1 1 97s |
O Operator está pronto para implantar recursos do CouchbaseCluster quando as implantações do Dynamic Admission Controller (couchbase-operator-admission) e do Operator (couchbase-operator) estiverem totalmente prontas e disponíveis.
Preparar a configuração do cluster do Couchbase
Implantarei um cluster de 3 nós do Couchbase Server 6.5.0 com o Prometheus Couchbase Exporter. Para isso, criei meu-cluster.yaml no diretório atual. Este é apenas o meu exemplo. Aqui está o arquivo:
|
1 2 3 4 5 6 7 8 9 10 11 12 13 14 15 16 17 18 19 20 21 22 23 24 25 26 27 28 29 30 31 32 33 34 35 36 37 38 39 40 41 42 43 44 45 46 47 48 49 50 51 52 53 54 55 56 57 58 59 60 61 62 63 64 65 66 67 68 69 70 71 72 73 74 |
apiVersion: v1 kind: Secret metadata: name: cb-example-auth type: Opaque data: username: QWRtaW5pc3RyYXRvcg== # Administrator password: cGFzc3dvcmQ= # password --- apiVersion: couchbase.com/v2 kind: CouchbaseCluster metadata: name: cb-example spec: image: couchbase/server:6.5.0 security: adminSecret: cb-example-auth paused: false antiAffinity: true softwareUpdateNotifications: true serverGroups: - us-east-1a - us-east-1b - us-east-1c securityContext: runAsUser: 1000 runAsNonRoot: true fsGroup: 1000 platform: aws cluster: clusterName: cb-example dataServiceMemoryQuota: 512Mi indexServiceMemoryQuota: 256Mi searchServiceMemoryQuota: 256Mi indexStorageSetting: memory_optimized autoFailoverTimeout: 120s autoFailoverMaxCount: 3 autoFailoverOnDataDiskIssues: true autoFailoverOnDataDiskIssuesTimePeriod: 120s autoFailoverServerGroup: false autoCompaction: databaseFragmentationThreshold: percent: 30 size: 1Gi viewFragmentationThreshold: percent: 30 size: 1Gi parallelCompaction: false timeWindow: start: 02:00 end: 06:00 abortCompactionOutsideWindow: true tombstonePurgeInterval: 72h servers: - size: 3 name: all_services services: - data - index - query - search buckets: managed: false selector: matchLabels: cluster: cb-example monitoring: prometheus: enabled: true image: couchbase/exporter:1.0.1 resources: requests: cpu: 100m memory: 100Mi |
Observações:
- Usei apenas um conjunto mínimo de parâmetros de configuração. Consulte a seção Documentação do recurso de cluster do Couchbase para obter uma lista completa.
- Incluiu a seção de segredos no mesmo arquivo para manter as coisas simples.
- Utilizou apenas os serviços de dados, consulta, índice e pesquisa.
- Gerenciar meus próprios baldes em vez de deixar isso para o Operador.
- Anote o rótulo do cluster cb-exemplo pois isso será usado pelo Prometheus para descobrir o serviço posteriormente.
Dica: Certifique-se de que buckets.managed esteja definido como false. Caso contrário, se você criar um bucket manualmente quando o cluster estiver em funcionamento, o Kubernetes o descartará automaticamente.
Implantar o cluster do Couchbase
|
1 2 3 4 |
cao-2 $ kubectl create -f my-cluster.yaml secret/cb-example-auth created couchbasecluster.couchbase.com/cb-example created |
Tanto o segredo quanto o cluster são criados. Isso não significa que eles já estejam em funcionamento; para isso, você terá que verificar conforme descrito na próxima etapa.
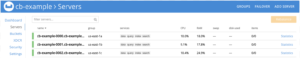
Verificar a implantação
|
1 2 3 4 5 6 7 8 |
cao-2 $ kubectl get pods NAME READY STATUS RESTARTS AGE cb-example-0000 2/2 Running 0 9m5s cb-example-0001 2/2 Running 0 8m53s cb-example-0002 2/2 Running 0 8m42s couchbase-operator-5c4bd54bbf-fcj9m 1/1 Running 0 10m couchbase-operator-admission-6789cd5847-w9rfd 1/1 Running 0 10m |
Certifique-se de que todos os pods estejam Pronto e Em execução. Caso haja algum problema, você pode obter os registros do Operador.
Opcional: Obter os registros
Se você encontrar algum problema na etapa anterior, poderá verificar os registros conforme mostrado abaixo.
|
1 2 3 4 5 6 7 8 |
cao-2 $ kubectl logs couchbase-operator-5c4bd54bbf-fcj9m {"level":"info","ts":1586879846.061044,"logger":"main","msg":"couchbase-operator","version":"2.0.0","revision":"release"} ...... {"level":"info","ts":1586879986.2216492,"logger":"cluster","msg":"Pod added to cluster","cluster":"default/cb-example","name":"cb-example-0002"} {"level":"info","ts":1586879987.0798743,"logger":"couchbaseutil","msg":"Rebalancing","cluster":"default/cb-example","progress":0} {"level":"info","ts":1586879993.087347,"logger":"cluster","msg":"Rebalance completed successfully","cluster":"default/cb-example"} {"level":"info","ts":1586879993.124682,"logger":"cluster","msg":"Reconcile completed","cluster":"default/cb-example"} |
Aqui, o cluster do Couchbase foi implantado sem nenhum erro.
Opcional: Examine um pod do Couchbase.
Vamos descrever um pod do Couchbase para verificar o que está sendo executado.
|
1 2 3 4 5 6 7 8 9 10 11 12 13 14 15 16 17 18 19 20 21 22 23 24 25 26 27 28 29 |
cao-2 $ kubectl describe pod cb-example-0000 Name: cb-example-0000 Namespace: default ... Labels: app=couchbase couchbase_cluster=cb-example ... {"containers":[{"name":"couchbase-server","image":"couchbase/server:6.5.0","ports":[{"name":"admin","containerPort":8091,"protocol":"TCP"} ... server.couchbase.com/version: 6.5.0 Status: Running ... Controlled By: CouchbaseCluster/cb-example Containers: couchbase-server: Container ID: docker://7b0e5df433582ad432114248fdce922fd92f63435b110265b823c013fea8c2ac Image: couchbase/server:6.5.0 ... State: Running ... metrics: Container ID: docker://b4406ec41d2119978971c8fa41fb8077ace782611298ba23d254a0d4383ab5ca Image: couchbase/exporter:1.0.0 Image ID: ... Port: 9091/TC ... State: Running |
Na saída acima, vemos que cada pod do Couchbase está executando 2 contêineres. O primeiro está executando o Couchbase Server 6.5.0 e o outro está executando o Couchbase Prometheus Exporter, que está usando a porta 9091.
Acessar a interface de administração do Couchbase
Em um ambiente de produção real, você normalmente implantaria usando o DNS e um LoadBalancer atuando como proxy e acessaria a interface do usuário do Couchbase de forma segura, com SSL usando registros DNS SRV. Como estamos em um ambiente de teste, acessaremos a interface do usuário do Couchbase diretamente da porta 8091. Precisamos de mais uma etapa para conseguir isso, que é o encaminhamento de porta.
Encaminhamento de portas
|
1 2 3 4 |
cao-2 $ kubectl port-forward cb-example-0000 8091 & [1] 11375 cao-2 $ Forwarding from 127.0.0.1:8091 -> 8091 Forwarding from [::1]:8091 -> 8091 |
Agora implantamos três pods; no entanto, basta fazer o port forward de um pod para acessar a interface de usuário de administração do Couchbase.
Acessar a interface do usuário
https://localhost:8091
Criar os buckets
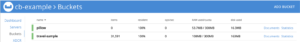
Adicione o bucket de amostra e crie o bucket de travesseiro
Executar uma carga de trabalho para gerar algumas métricas
Usaremos cbc-pillowfight para gerar a carga de trabalho. Felizmente, isso vem junto com o Operator e vamos implementá-lo. Vamos fazer uma pequena modificação no arquivo YAML primeiro, para que ele não pare de carregar os dados, mas execute operações no bucket. Usaremos o bucket de travesseiros que acabamos de criar.
|
1 2 3 4 5 6 7 8 9 10 11 12 13 14 15 16 |
apiVersion: batch/v1 kind: Job metadata: name: pillowfight spec: template: metadata: name: pillowfight spec: containers: - name: pillowfight image: sequoiatools/pillowfight:v5.0.1 command: ["cbc-pillowfight", "-U", "couchbase://cb-example-0000.cb-example.default.svc/pillow?select_bucket=true", "-I", "10000", "-B", "1000", "-c", "10000", "-t", "1", "-u", "Administrator", "-P", "password"] restartPolicy: Never |
Altere o bucket de padrão para pillow e altere a opção -c (número de loops) de 10 para 10.000.
Então:
|
1 2 |
cao-2 $ kubectl create -f pillowfight-data-loader.yaml job.batch/pillowfight created |
Testando o Prometheus e o Grafana localmente
Agora temos um cluster do Couchbase de três nós com o Prometheus Couchbase Exporter. O Exporter está extraindo as métricas do Couchbase para a porta 9091. Agora, poderíamos encaminhar essa porta da mesma forma que encaminhamos a porta 8091 para acessar a interface do usuário do Console da Web do Couchbase em nosso desktop. Com essa porta encaminhada, poderíamos ter o Prometheus e o Grafana em execução em contêineres do Docker no desktop e usar a porta 9091 encaminhada para obter as métricas no Prometheus e visualizá-las no Grafana.
Com a abordagem acima, há uma limitação. A primeira é que teríamos que encaminhar a porta 9091 de todos os três nós e esses nomes de nós seriam codificados. A codificação de nomes de nós é um grande problema em um ambiente Kubernetes. Além disso, você realmente não faria o encaminhamento de portas em um ambiente de produção, onde normalmente faria a implantação com DNS e usaria o DNS SRV para se conectar ao cluster. Por fim, sua prática recomendada é executar o Prometheus e o Grafana no próprio Kubernetes, alinhando-se ao paradigma nativo da nuvem.
Próximas etapas
Em Parte 2Se você não tiver um DNS, faremos exatamente isso, com exceção do DNS, pois ainda queremos manter isso o mais simples possível para testes rápidos.
Recursos:
- Faça o download do Couchbase Autonomous Operator 2.0 Beta para Kubernetes
- Introdução ao Couchbase Autonomous Operator 2.0 Beta
- Tutorial - Operador autônomo do Couchbase no EKS
- Compartilhe suas ideias sobre o Fóruns do Couchbase
Obrigado, Prasad, por compartilhar. Posso perguntar quais são as principais métricas a serem monitoradas para decidir quando escalar o cluster e se é possível configurar o escalonamento automático do cluster couchbase no K8s?
Saudações