PowerBI 및 네이티브 JSON 처리
| PowerBI는 데이터를 시각화하는 데 사용할 수 있는 훌륭한 새 보고 환경 중 하나입니다. PowerBI의 가장 큰 장점은 기본 JSON 지원과 내장된 프로그래밍 가능한 변환 엔진입니다. PowerBI는 Couchbase Server와 직접 대화하여 데이터를 보고할 수 있습니다. ODBC 또는 JDBC 드라이버가 필요하지 않습니다! |  |
4단계로 Couchbase Server v4에서 데이터 시각화하기
PowerBI에서 Couchbase Server 데이터를 시각화하는 4단계를 살펴보겠습니다:
#1 샘플 데이터를 가져옵니다:
Couchbase Server 4와 함께 제공되는 여행 샘플 버킷을 사용하고 있습니다. 관리자 콘솔의 "설정" 탭을 사용하거나 설치 중에 이 데이터 집합을 설치합니다. 예제와 함께 따라할 수 있습니다.
#2 N1QL REST API를 통해 쿼리합니다:
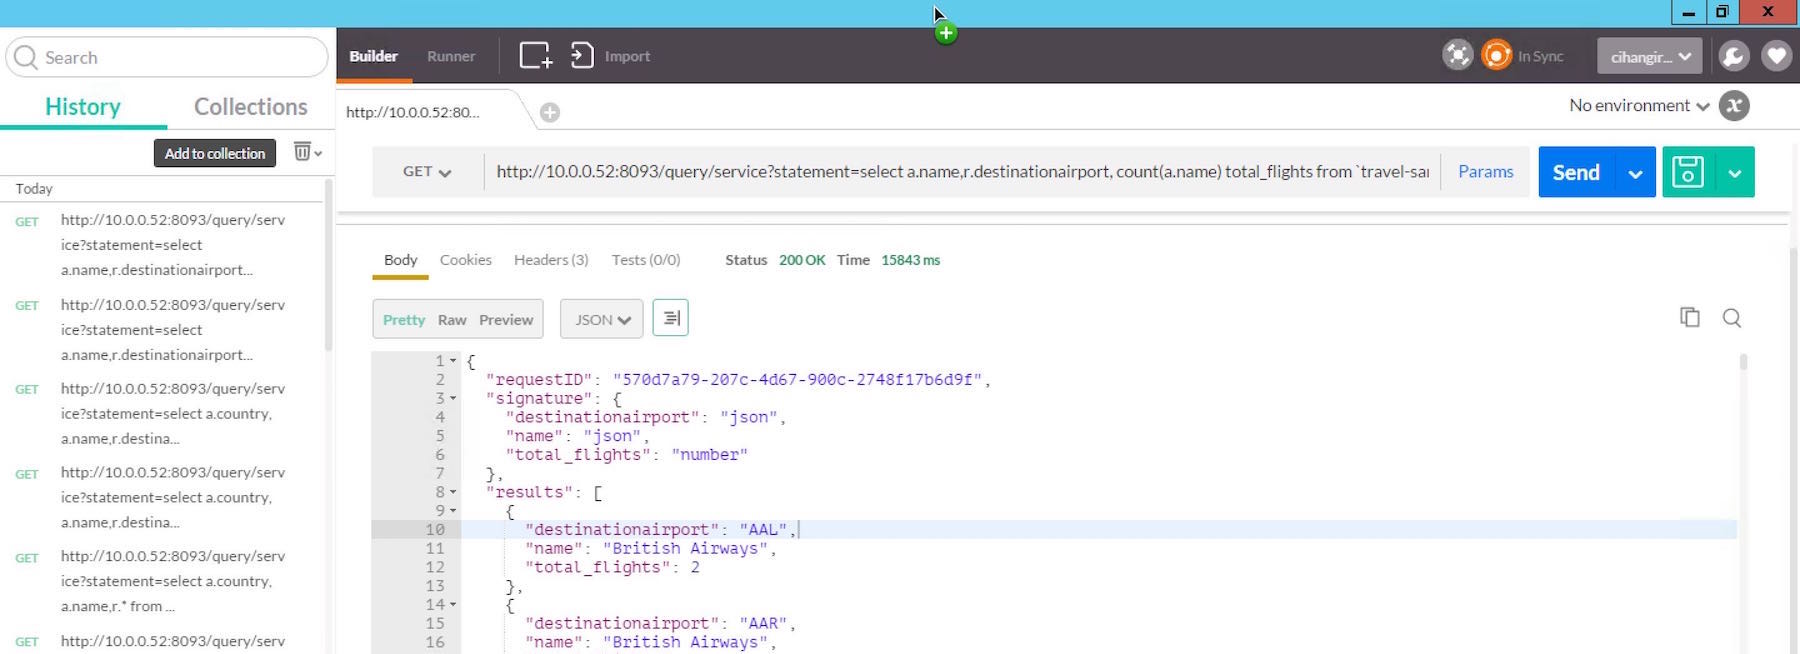
샘플로 매우 간단한 쿼리를 사용하겠습니다: 이 쿼리는 각 목적지 공항으로 가는 총 항공편이 포함된 모든 항공사의 전체 목록을 반환합니다.
|
1 2 3 4 5 |
선택 a.이름, r.목적지공항, 카운트(a.이름) as 총 항공편 FROM `여행-샘플` r JOIN `여행-샘플` a 켜기 키 r.airlineid 어디 r.유형 ="경로" AND a.유형="항공사" 그룹 BY r.목적지공항, a.이름 주문 BY r.목적지공항 |
PowerBI를 다음과 연결하려면 N1QL. 쿼리를 실행하기 위해 N1QL REST API를 사용하겠습니다. 잘 모르시는 분들도 계시겠지만 N1QL에는 애드혹 문을 받는 REST API가 함께 제공됩니다. N1QL REST API는 문서화되어 있습니다. 여기 로 설정하면 원하는 JSON 인식 도구를 사용하여 이 API를 직접 호출할 수 있습니다. 제가 선택한 도구는 우편 배달원 (크롬 마켓플레이스에서도 사용 가능). 포스트맨과 결합된 N1QL REST API는 유선을 통해 전송되는 내용을 완벽하게 파악할 수 있게 해줍니다.
다음 그림에서는 위의 쿼리로 포트 8093의 로컬 클러스터 노드에 postman으로 접속하고 있습니다.
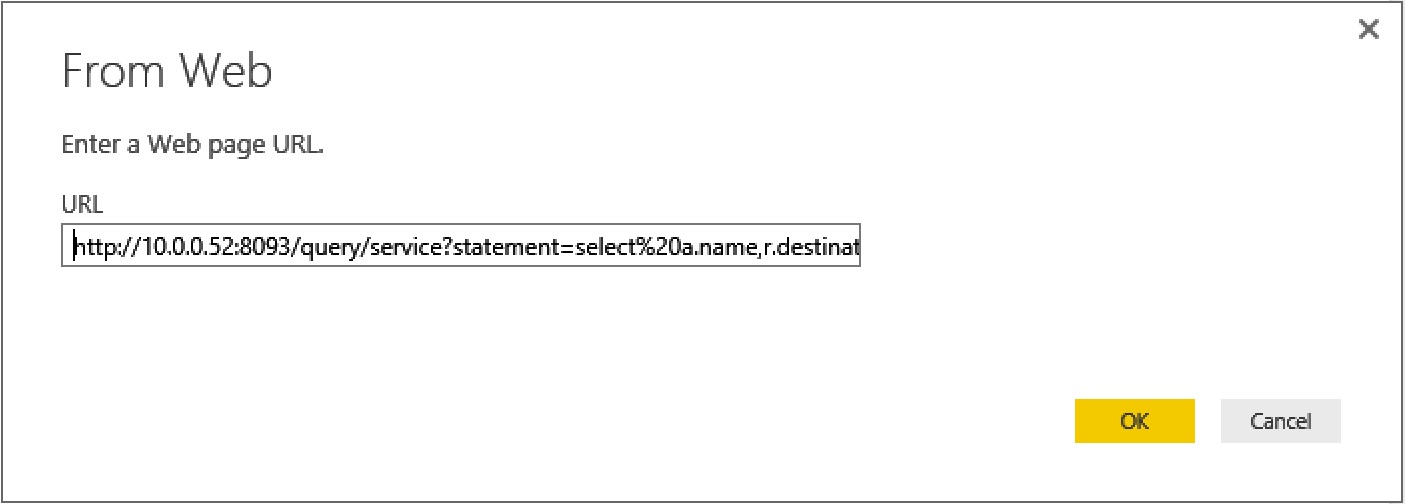
인코딩된 URL을 Power BI에 전달하면 다음과 같이 표시됩니다:
|
1 |
http://10.0.0.52:8093/query/service?statement=select%20a.name,r.destinationairport,%20count(a.name)%20total_flights%20from%20`travel-sample`%20r%20join%20`travel-sample`%20a%20on%20keys%20r.airlineid%20where%20r.type%20=%22route%22%20and%20a.type=%22airline%22%20group%20by%20r.destinationairport,%20a.name%20order%20by%20r.destinationairport |
#3 PowerBI에서 데이터 제출 및 변환:
마지막으로 데스크톱 버전의 Power BI를 실행해야 합니다. 데스크톱 버전은 무료이며 다음에서 사용할 수 있습니다. 여기.
- "데이터 가져오기" 메뉴로 이동하여 방법으로 "웹"을 선택합니다. 위의 URL을 입력하고 데이터가 표시될 때까지 기다립니다.
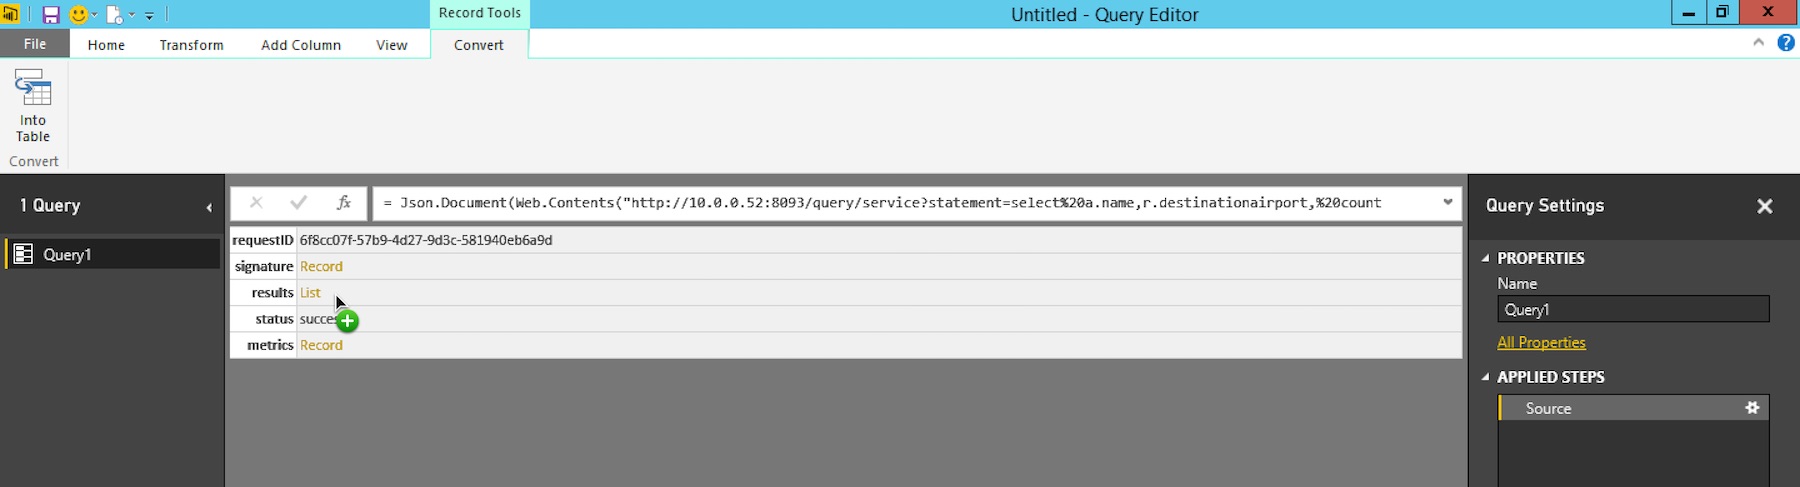
- 이제 일련의 변환을 통해 데이터를 시각화할 수 있도록 준비하겠습니다.
- 결과가 Power BI로 스트리밍되면 N1QL에서 반환되는 JSON 속성을 볼 수 있습니다. 화면에서 '목록' 링크를 클릭하여 '결과'를 드릴다운합니다.
- 테이블 트랜스폼을 사용해 JSON의 모양을 만들겠습니다. 상단의 '테이블로' 메뉴를 클릭하고 구분 기호를 지정하지 마세요. "확인"을 클릭하기만 하면 됩니다.
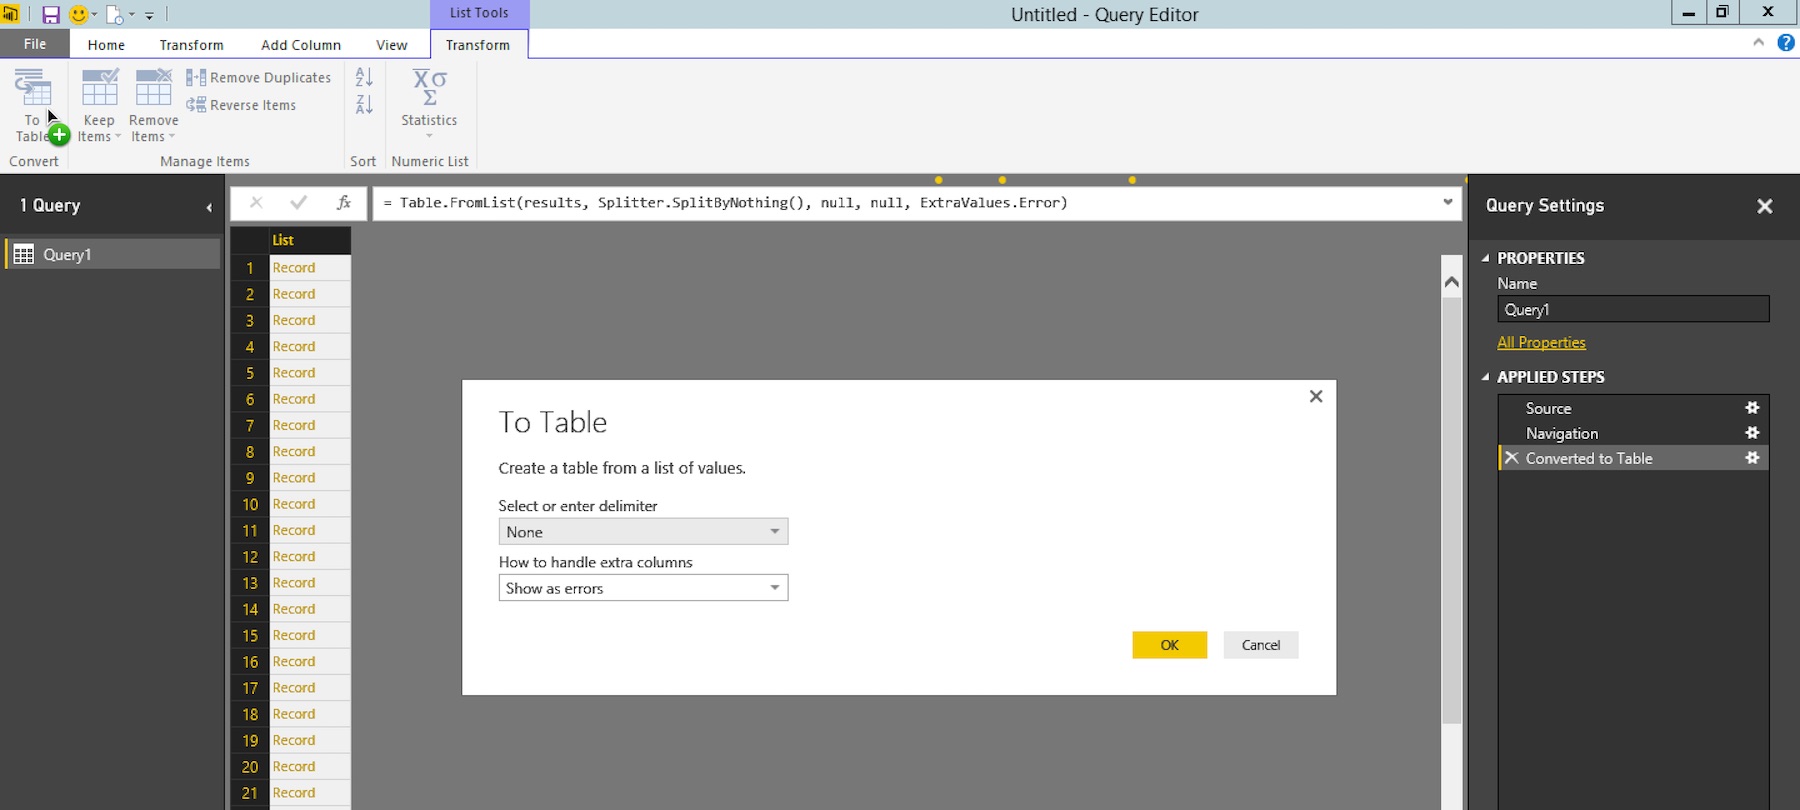
- 다음으로, 단일 열 그리드의 열 상단에 있는 작은 '분할' 아이콘을 클릭하여 JSON의 속성을 테이블의 개별 열로 분할합니다.
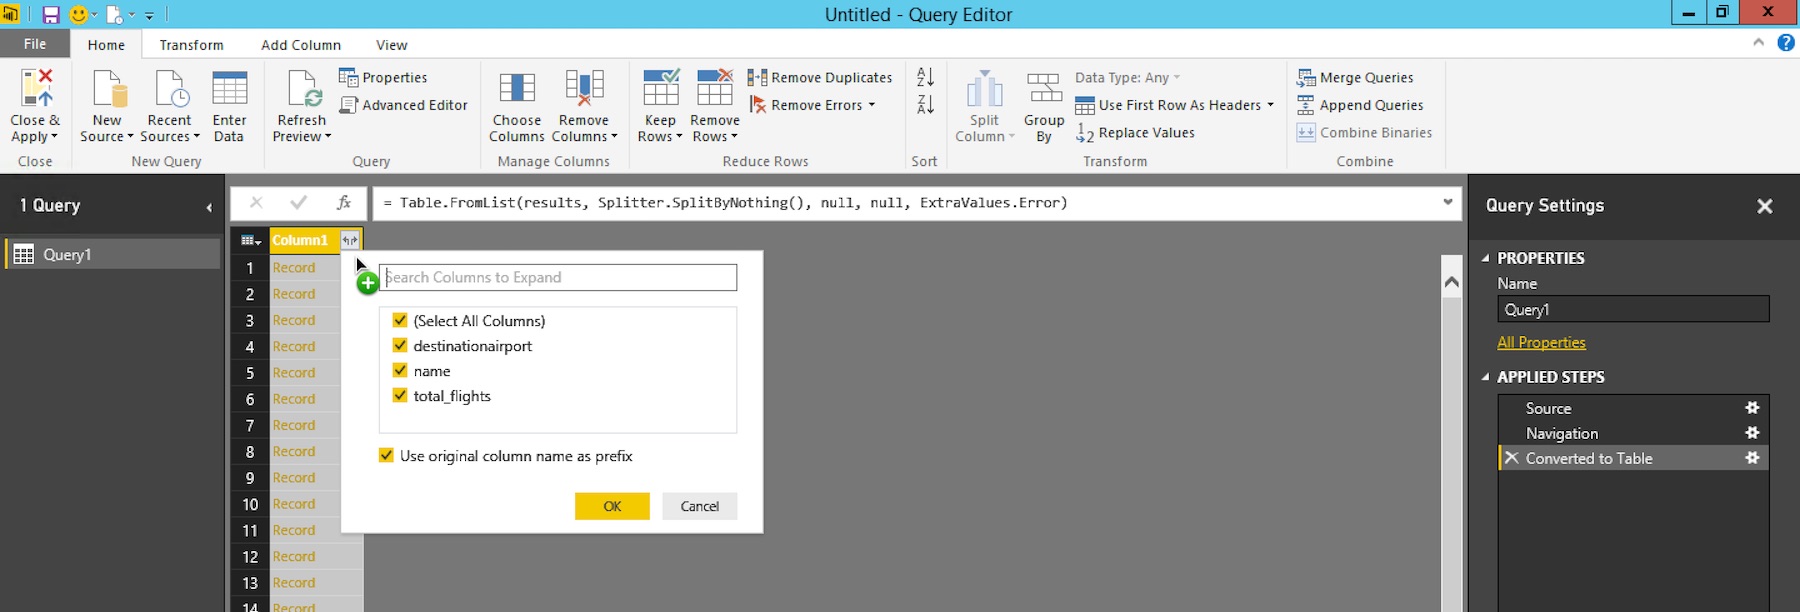
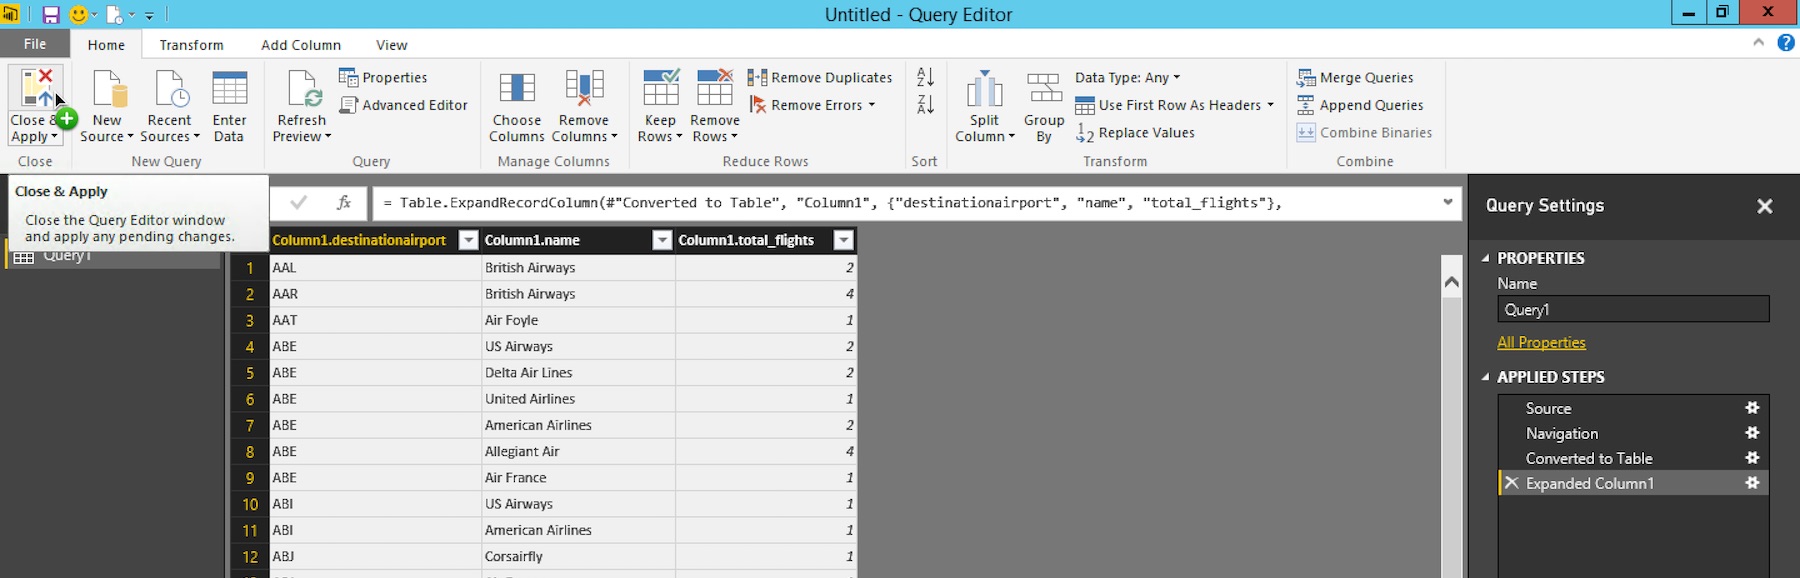
- 확인을 클릭하면 완료된 데이터 변환의 모습은 다음과 같습니다... 왼쪽 상단의 '닫기 및 적용'을 클릭하기만 하면 됩니다.
#4 PowerBI에서 데이터 시각화:
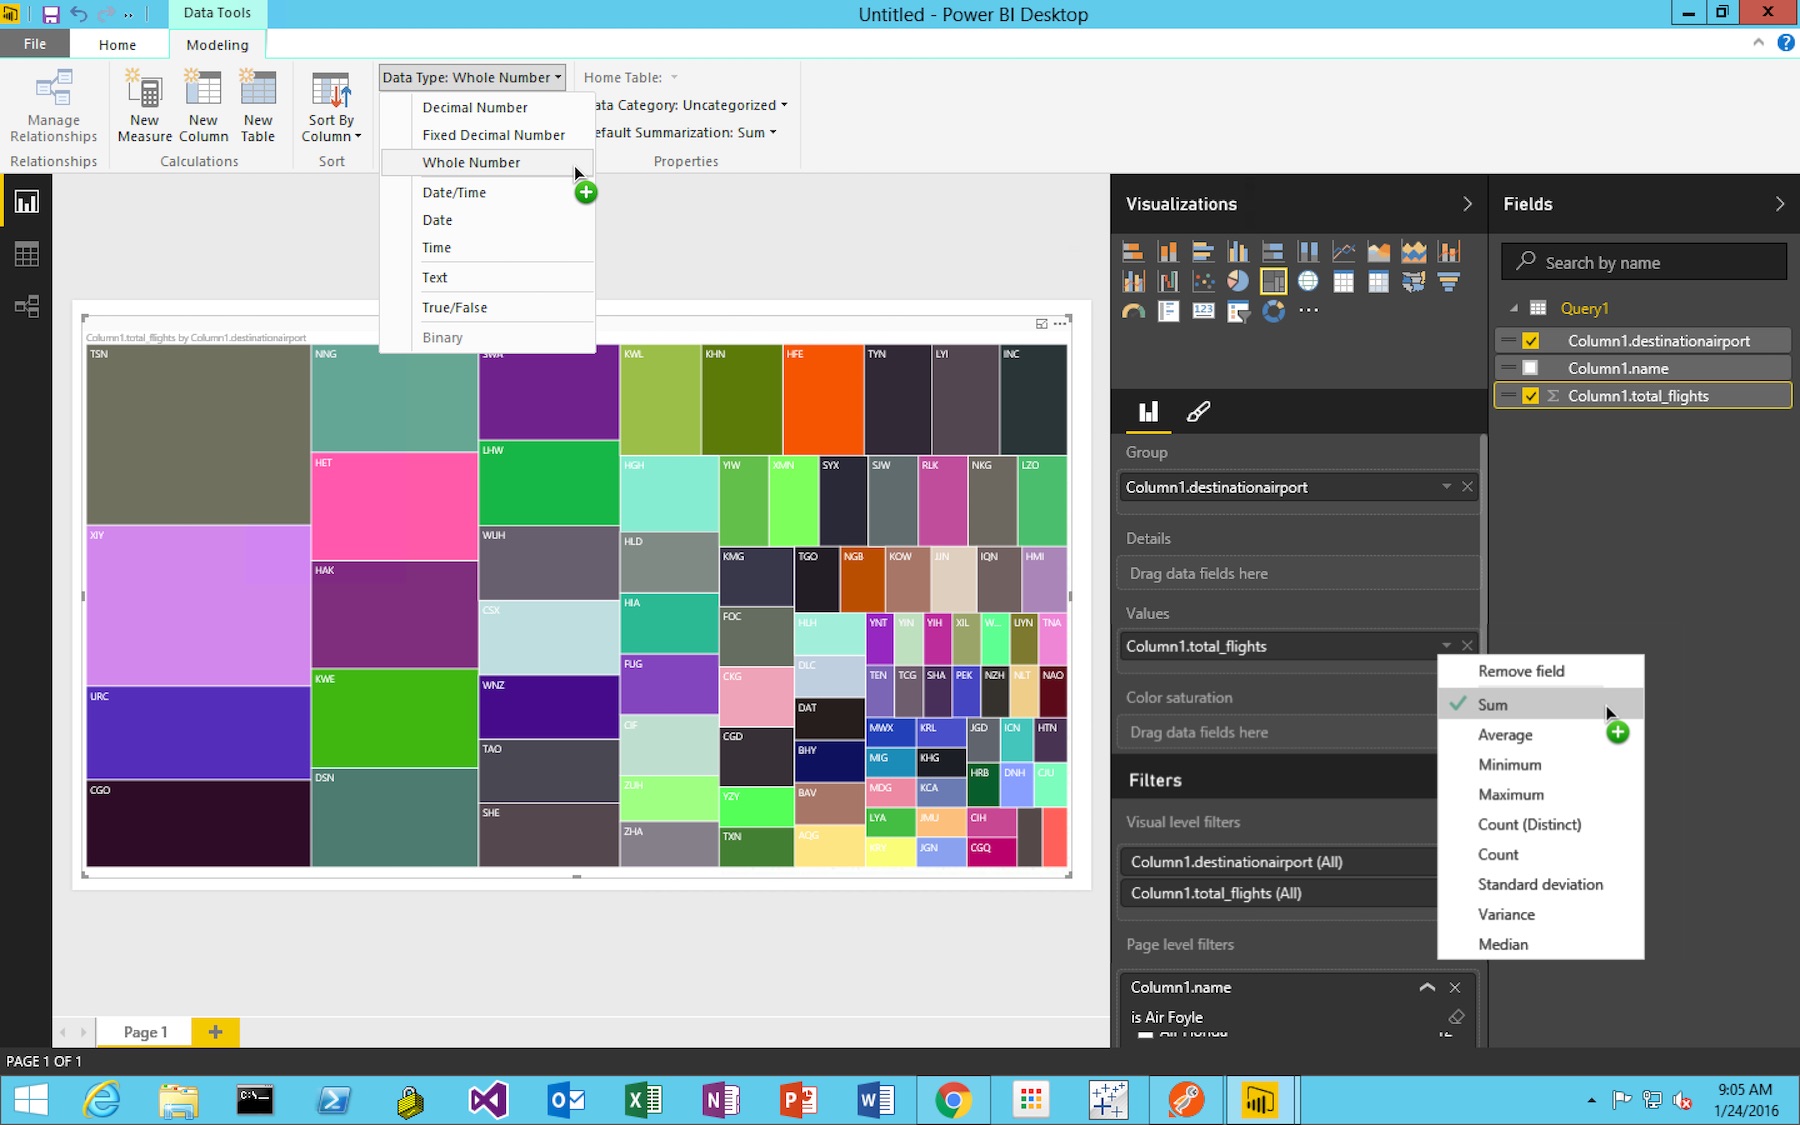
저는 각 항공사의 가장 인기 있는 목적지를 표시하는 데 TreeMap 비주얼리제이션을 즐겨 사용합니다. 그곳에 가려면,
- "Column1.destinationairport"를 아래의 그룹
- "Column1.total_flights"를 다음 위치로 드래그합니다. 값.
- "Column1.name"을 다음 위치로 드래그합니다. 페이지 수준 필터 을 클릭하고 필드를 확장하여 '에어 포일'을 필터링합니다.
또한 total_flights의 데이터 유형도 수정합니다. 이를 위해서는 두 번의 클릭이 더 필요합니다. 아래 그림의 녹색 더하기를 클릭합니다.
- total_flights 열의 데이터 유형을 "전체 숫자"로 변경합니다.
- total_flights의 집계를 "합계"로 변경합니다.
이제 끝났습니다!
또한 ODBC/JDBC를 사용하여 Couchbase Server 데이터에 연결할 수도 있다는 점도 언급하고 싶습니다. 무료로 다운로드할 수 있는 링크는 다음과 같습니다. 카우치베이스 서버용 ODBC 및 JDBC 드라이버.
하지만... 오늘날 생성되고 저장되는 새로운 데이터의 대부분은 JSON으로 되어 있습니다. 따라서 PowerBI와 같은 새로운 데이터 시각화 플랫폼은 JSON에 대한 강력한 지원을 추가하고 있습니다. PowerBI는 ODBC 드라이버 없이도 카우치베이스 서버의 데이터로 매우 쉽게 작업할 수 있게 해주는 훌륭한 기능을 제공합니다.
행복한 해킹.
씨한 비이코글루 - 제품 관리 이사