이 블로그는 고등학생 인턴인 Karen Yuan이 공동 작성했습니다.
우리의 이전 글 Couchbase 쿼리 서비스를 사용하여 탐색적 데이터 분석을 수행하는 방법을 배웠습니다. 또한 Couchbase Python SDK의 쿼리 API를 사용하여 학습 데이터를 효율적으로 읽고 머신 러닝(ML)에 적합한 판다스 데이터 프레임에 원활하게 저장하는 방법도 배웠습니다. 그리고 마지막으로 ML 모델과 해당 메타데이터를 Couchbase에 저장했습니다. 이 글에서는 예측을 생성하고, 이를 Couchbase에 저장하고, 쿼리 차트를 사용하여 분석하는 방법에 대해 알아보겠습니다.
실시간 예측
데이터 과학자는 학습된 모델을 사용하여 예측을 생성합니다.
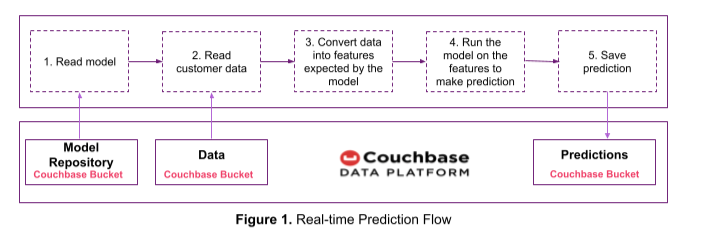
그림 1의 예측 흐름을 사용하여 실시간으로 이탈 점수를 예측하고 예측 결과를 Couchbase에 저장하겠습니다. 이전 글에서 학습한 이탈 예측 모델을 사용하겠습니다.
카우치베이스에 저장된 모델과 해당 메타데이터를 읽는 함수입니다:
|
1 2 3 4 5 6 7 |
def read_model_from_couchbase(model_id): bucket = cluster.bucket('model_repository') model_bytes = bucket.get(model_id).value model = pickle.loads(model_bytes) key = model_id + "_metadata" feature_names = bucket.get(key).value['feature_names'] return {'model': model, 'feature_names': set(feature_names)} |
카우치베이스에 저장된 고객 데이터를 읽는 기능입니다:
|
1 2 3 4 5 6 7 8 9 10 11 12 13 14 15 16 |
# We will use the Query interface in the Couchbase Python SDK to get multiple customer # records that satisfy a condition. Alternatively, the GET interface in the Couchbase Python SDK can # be used to get individual customer records e.g. bucket.get(customer_key).value def read_data_from_couchbase(select_clause = "", where_clause = ""): if select_clause: query_statement = "SELECT customer.*, " + select_clause else: query_statement = "SELECT customer.*" query_statement = query_statement + " FROM `online_streaming` as customer" if where_clause: query_statement = query_statement + " WHERE " + where_clause # Use the Query API to get customer records query_result = cb.query(query_statement) return pd.DataFrame.from_dict(list(query_result)) |
다음 사항 예측 함수는 위의 함수를 사용하여 모델, 메타데이터 및 고객 레코드를 읽습니다. 학습 중에 사용된 것과 동일한 프로세스(즉, 원핫 인코딩)를 사용하여 고객 데이터를 피처로 변환합니다. 그런 다음 이 특징에 대해 모델을 실행하여 이탈 점수를 예측합니다.
|
1 2 3 4 5 6 7 8 9 10 11 12 13 14 15 16 17 18 19 |
def predict(model_id, select_clause = "", where_clause = ""): # Step 1: Read the model and its metadata from Couchbase rv = read_model_from_couchbase(model_id) model = rv['model'] feature_names = rv['feature_names'] # Step 2: Read customer records from Couchbase df = read_data_from_couchbase(select_clause, where_clause) customer_prediction = df # Step 3: Convert the raw data into features expected by the model df = pd.get_dummies(df) drop_cols = set(list(df.columns)) - feature_names df.drop(drop_cols, axis = 1, inplace = True) df = df.reindex(columns=feature_names, fill_value=0) # Step 4: Predict prediction = model.predict(df) customer_prediction['Churn Prediction'] = prediction return customer_prediction |
|
1 2 3 |
# Example: Predict churn for a customer with given ID prediction = predict('churn_predictor_model_v1', where_clause = "customer.CustomerID = 100002")[['CustomerID', 'Churn Prediction']] prediction |
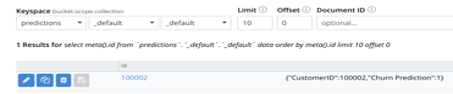
다음 대상에 대한 이탈 예측 customerID 100002 이 1이면 스트리밍 서비스를 떠날 가능성이 높다는 뜻입니다.
![]()
예측은 아래 표시된 코드를 사용하여 예측이라는 Couchbase 버킷에 저장됩니다. 계속 진행하기 전에 Couchbase 클러스터에 예측 버킷을 만드세요.
|
1 2 3 4 |
bucket = cluster.bucket('predictions') to_save = prediction.to_dict(orient="records")[0] key = str(prediction.iloc[0]['CustomerID']) bucket.upsert(key, to_save) |
예측이 Couchbase에 성공적으로 저장되었는지 확인합니다.
Python UDF 기능(현재 개발자 프리뷰 버전)을 사용하여 학습된 모델을 실행하고 Couchbase Analytics에서 예측을 생성할 수도 있습니다. 다음 문서를 참조하세요. 카우치베이스 애널리틱스 파이썬 UDF를 사용하여 ML 모델 실행하기 에서 자세한 내용을 확인하세요.
가정 분석
데이터 과학자는 예측을 분석하여 의사 결정에 도움이 되는 질문에 답합니다.
이전 글에서 정의한 문제는 온라인 스트리밍 서비스 회사의 영업팀이 월별 비용을 늘리면 고객 이탈을 억제하면서 수익을 극대화할 수 있는지 알고 싶어하는 것이었습니다.
이에 대한 답을 구하기 위해 아래 코드를 사용하여 월별 비용이 $1, $2 등으로 증가했을 때의 이탈 점수를 예측합니다. 이 분석 결과는 예측 버킷에 저장됩니다.
Couchbase 클러스터 UI를 사용하여 다음과 같은 범위를 만듭니다. what_if_analysis 라는 컬렉션과 증가_월별_비용 을 예측 버킷에 추가합니다. (범위 및 컬렉션은 Couchbase Server 7.0 이상에서 사용할 수 있습니다.)
|
1 2 3 4 5 6 7 8 9 10 11 12 13 14 15 16 17 18 19 20 21 22 23 24 25 26 27 28 29 30 31 |
# Connect to predictions bucket on Couchbase and relevant scope and collection bucket = cluster.bucket('predictions') wa_scope = bucket.scope("what_if_analysis") wa_collection = wa_scope.collection("increase_monthly_cost") # Predict the churn rate if the monthly cost of existing customers is increased by # $1, $2 .. $5 for increase_by in range (1, 6): # where_cluase is set to customer.Churn = 0 because we are interested # only in existing customers # The following select_clause will update the MonthlyCost as shown while returning the # query result. In each iteration of this loop the MonthlyCost will increase by $1, $2 ... select_clause = "customer.`MonthlyCost` + " + str(increase_by) + " as `MonthlyCost`" # The updated MonthlyCost is passed as input along with other attributes to the prediction # function. The output tells which of the existing customers are likely to # to churn if the MonthlyCost is increased by the specified amount. rv = predict('churn_predictor_model_v1', select_clause = select_clause, where_clause = "customer.Churn = 0") # Monthly revenues are predicted by adding the monthly cost of the customers not likely to churn. rv['Predicted Monthly Revenue'] = (1 - rv['Churn Prediction']) * rv['MonthlyCost'] predicted_churn_rate = rv['Churn Prediction'].value_counts(normalize=True).mul(100)[1] # Save predictions to Couchbase. to_save = {'Monthly Cost Increase ($)': increase_by, 'Predicted Monthly Revenue': rv['Predicted Monthly Revenue'].sum(), 'Predicted Churn Rate': predicted_churn_rate} key = "increase_by_$" + str(increase_by) wa_collection.upsert(key, to_save) # Use the Query API to calculate current revenue. Store it also on the predictions bucket. This is # used for comparison current = cb.query('SELECT sum(customer.`MonthlyCost`) as CurrentRevenue FROM `online_streaming` customer where customer.Churn = 0') to_save = {'Monthly Cost Increase ($)': 0, 'Predicted Monthly Revenue': list(current)[0]['CurrentRevenue'], 'Predicted Churn Rate': 0} wa_collection.upsert("current", to_save) |
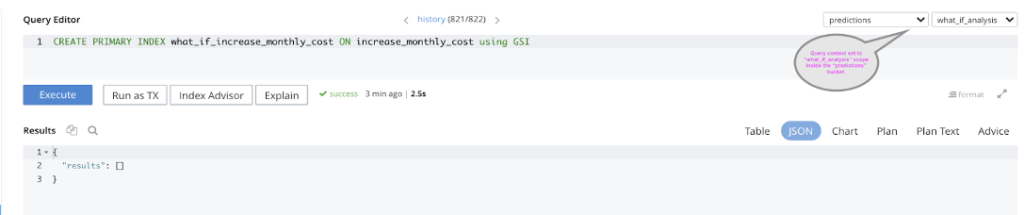
카우치베이스 쿼리를 사용하여 예측 결과를 분석하려면 다음과 같이 기본 인덱스를 만듭니다. what_if_analysis 범위를 설정합니다. 쿼리 컨텍스트는 그림과 같이 설정해야 합니다.
쿼리 차트를 사용하여 예측 결과를 분석할 수 있습니다. 아래 차트에서는 월 비용이 $1 증가할 경우 기존 고객 중 약 7%가 이탈할 것으로 예측되고, 월 비용이 $2 증가할 경우 약 10%가 이탈할 것으로 예측되는 등 기존 고객의 이탈 가능성이 높은 것으로 나타났습니다.
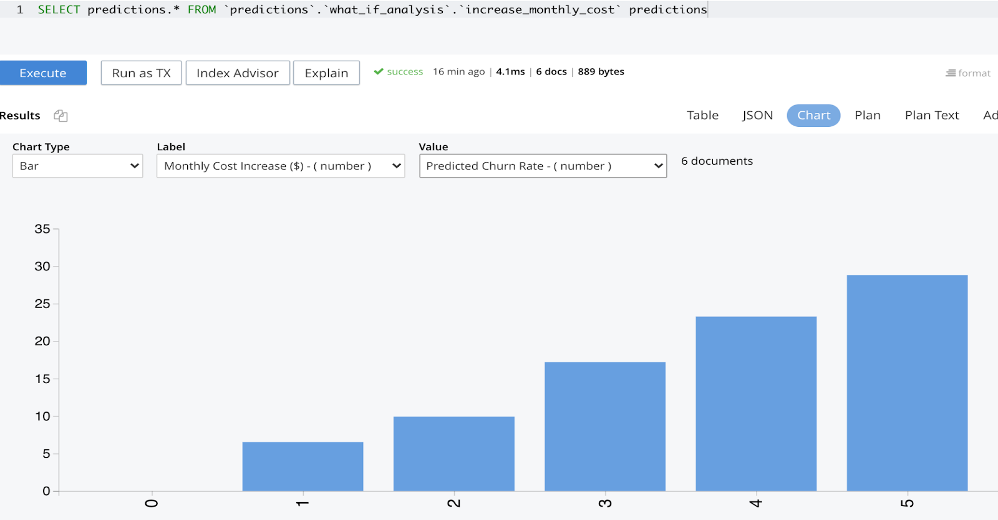
아래 차트는 현재 월 매출이 $315만임을 보여줍니다. 이 수익은 기존 고객의 월 구독 비용이 $1만큼 증가하면 약 $5만 원, 월 비용이 $2만큼 증가하면 약 $23만 원이 증가할 것으로 예측됩니다. 그러나 월 비용이 $3 이상 증가하면 예상 이탈률이 높아져 수익이 감소할 것으로 예측됩니다.
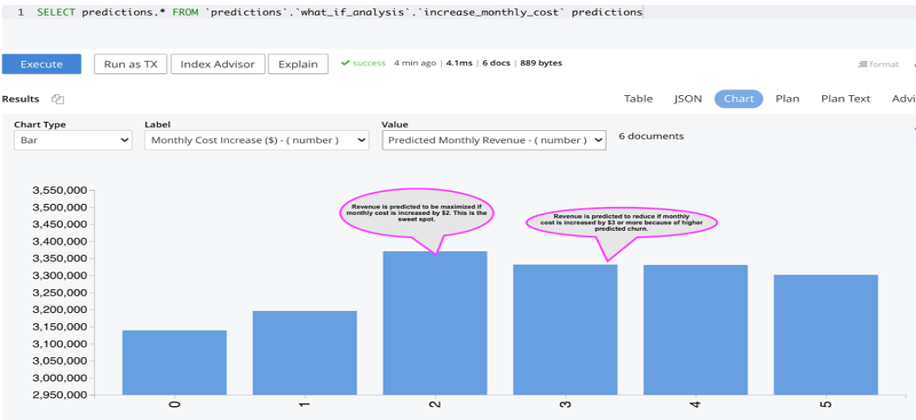
이 분석을 통해 온라인 스트리밍 서비스 회사의 영업팀은 이탈률을 억제하면서 수익을 극대화하기 위해 월 구독료를 $2로 인상할 수 있다는 결론을 내릴 수 있습니다.
쿼리 UI의 '차트 다운로드' 옵션을 사용하여 차트를 저장할 수 있습니다.
카우치베이스 애널리틱스 서비스
파이썬 SDK의 Couchbase 쿼리 API를 사용하여 Couchbase에서 데이터를 읽었습니다. 대신 Couchbase Analytics API를 사용하려는 경우 다음은 Couchbase에서 데이터를 읽고 판다스 데이터 프레임에 저장하는 예제입니다.
|
1 2 |
analytics_result = cb.analytics_query("SELECT customer.* FROM online_streaming customer") analytics_raw_data = pd.DataFrame(analytics_result) |
카우치베이스 애널리틱스 서비스는 EDA, 데이터 시각화 및 학습된 ML 모델(개발자 미리 보기)을 실행하는 데에도 사용할 수 있습니다. 자세한 내용은 애널리틱스용 N1QL 언어 참조 에 대한 기사 카우치베이스 애널리틱스 파이썬 UDF를 사용하여 ML 모델 실행하기 에서 자세한 내용을 확인하세요.
결론
이번 글과 이전 글에서 Couchbase가 데이터 과학을 쉽게 만드는 방법에 대해 알아보았습니다. 고객 이탈 예측을 예로 들어, 쿼리 서비스를 사용하여 탐색적 분석을 수행하는 방법과 Python SDK를 사용하여 대규모 학습 데이터 세트를 효율적으로 읽고 ML에 적합한 데이터 구조로 쉽게 저장하는 방법을 살펴보았습니다.
또한 ML 모델, 메타데이터 및 예측을 Couchbase에 저장하는 방법과 예측을 분석하기 위해 쿼리 차트를 사용하는 방법도 살펴봤습니다.
카우치베이스 데이터 플랫폼은 쿼리 및 분석 서비스를 실행하는 클러스터와 동일한 클러스터에 원시 데이터, 기능, ML 모델, 해당 메타데이터 및 예측을 저장하는 데 사용할 수 있습니다. 이렇게 하면 데이터 과학에 필요한 도구의 수를 줄여 프로세스를 빠르고 쉽게 진행할 수 있습니다.
다음 단계
머신 러닝과 Couchbase에 대해 자세히 알아보고 싶다면 다음 단계와 리소스를 통해 시작하세요:
- Couchbase Cloud 무료 평가판 시작하기 - 설치가 필요하지 않습니다.
- 카우치베이스 내부 살펴보기: 아키텍처 개요 - 이 백서를 통해 기술적 세부 사항을 자세히 알아보세요.
- 카우치베이스 살펴보기 쿼리, 전체 텍스트 검색, 이벤트및 분석 서비스.
- 이 ML 블로그를 확인하세요:
