PowerBI and Native JSON Processing
| PowerBI is one of the great new reporting environments you can use to visualize data. One great advantage of PowerBI is its native JSON support and built-in programmable transformation engine. Power-BI can simply directly talk to Couchbase Server and report on the data. No es necesario ningún controlador ODBC o JDBC. |  |
Visualize data in Couchbase Server v4 in 4 Steps
Lets walk through the 4 steps to get your Couchbase Server data visualized in PowerBI:
#1 Obtener algunos datos de muestra:
Estoy usando el bucket travel-sample que viene con Couchbase Server 4. Instala este conjunto de datos usando la pestaña "settings" en la consola de administración o durante la instalación. Podrás seguir los ejemplos.
#2 Consulta a través de la API REST N1QL:
Utilizaré una consulta bastante sencilla para el ejemplo: Esta consulta devuelve la lista completa de todas las aerolíneas con sus vuelos totales a cada aeropuerto de destino.
|
1 2 3 4 5 |
SELECCIONE a.nombre, r.destinoaeropuerto, cuente(a.nombre) como total_vuelos DESDE `viaje-muestra` r ÚNASE A `viaje-muestra` a EN TECLAS r.airlineid DONDE r.tipo ="ruta" Y a.tipo="aerolínea" GRUPO POR r.destinoaeropuerto, a.nombre PEDIR POR r.destinoaeropuerto |
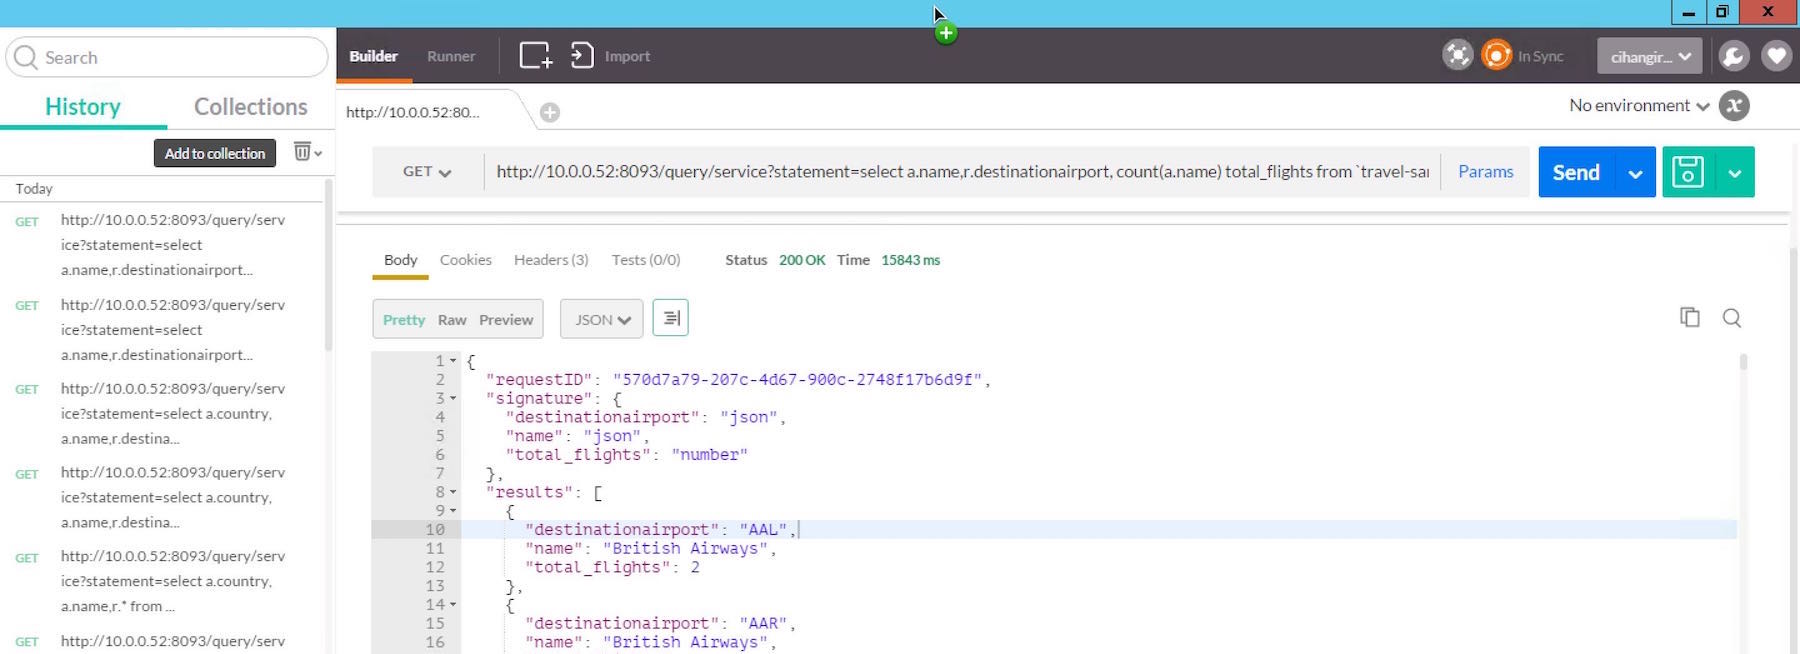
To connect PowerBI with N1QL. We will use the N1QL REST API to execute the query. Some may not know this but N1QL comes with a REST API that takes in an ad-hoc statement. N1QL REST API is documented aquí y usted puede utilizar la herramienta consciente de JSON de su elección para golpear directamente esta API. Mi herramienta preferida es Cartero (disponible también en chrome marketplace). N1QL REST API combinado con postman me da la visibilidad completa de lo que está viajando a través del cable.
En la siguiente figura, estoy golpeando un nodo de cluster local en el puerto 8093 con la consulta anterior con postman.
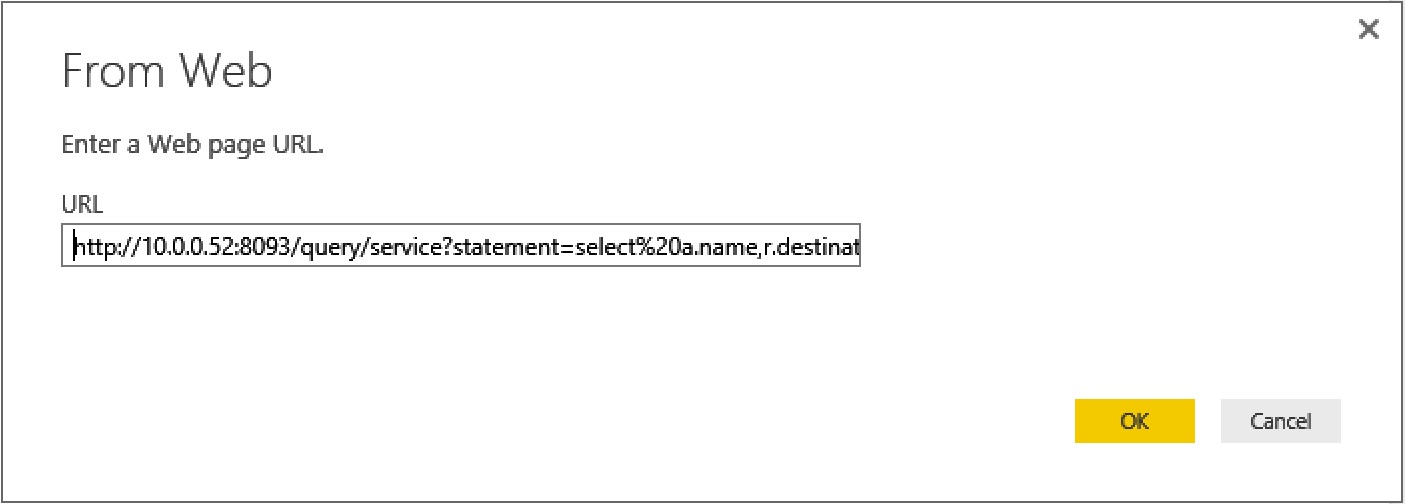
We will pass the encoded URL to Power BI and it looks like this:
|
1 |
http://10.0.0.52:8093/query/service?statement=select%20a.name,r.destinationairport,%20count(a.name)%20total_flights%20from%20`travel-sample`%20r%20join%20`travel-sample`%20a%20on%20keys%20r.airlineid%20where%20r.type%20=%22route%22%20and%20a.type=%22airline%22%20group%20by%20r.destinationairport,%20a.name%20order%20by%20r.destinationairport |
#3 Submit & Transform Data in PowerBI:
Last, you need to fire up the desktop version of Power BI. Desktop version is free and is available aquí.
- Goto “Get Data” menu and choose “Web” as the method. Enter in the URL above and wait for the data to show up.
- Ahora pasaremos por una serie de transformaciones para preparar nuestros datos para la visualización.
- Once the results are streamed into Power BI, you will see the JSON attributes that come back from N1QL. Drill into “results” by clicking the “List” link in the screen.
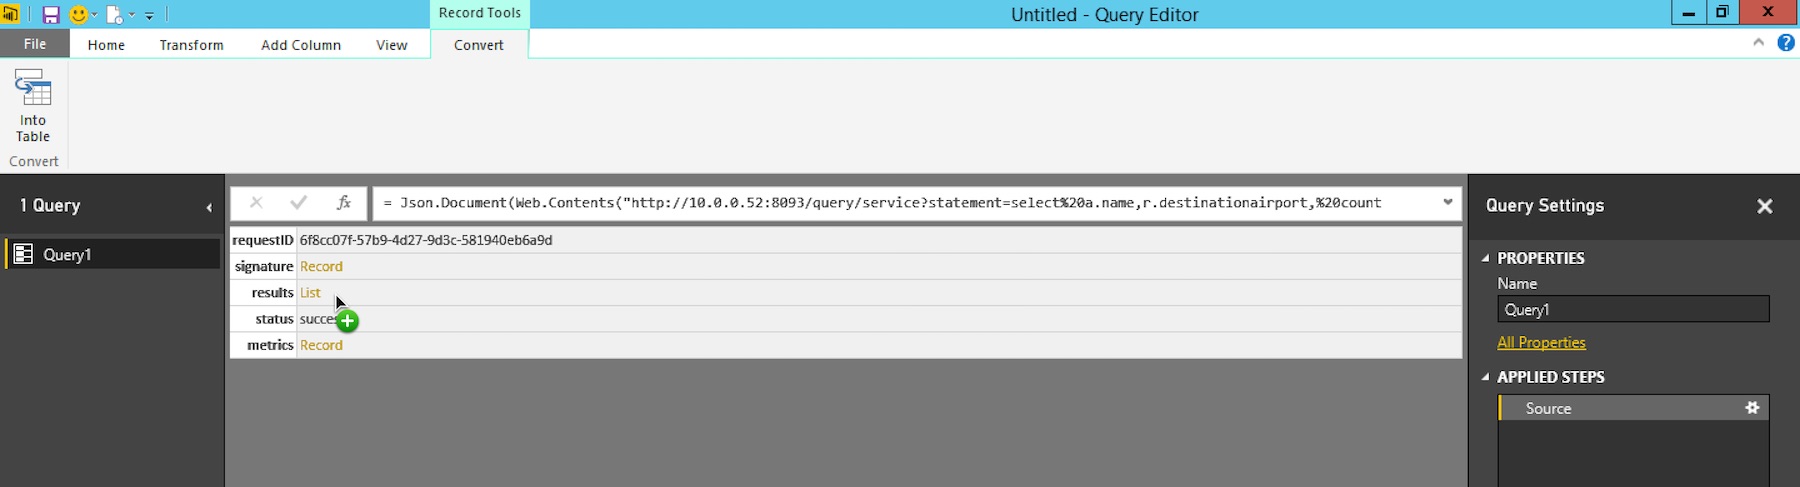
- We will use the table transform to shape our JSON. Click on “To Table” menu at the top and don’t specify a delimiter. Simply click “OK”.
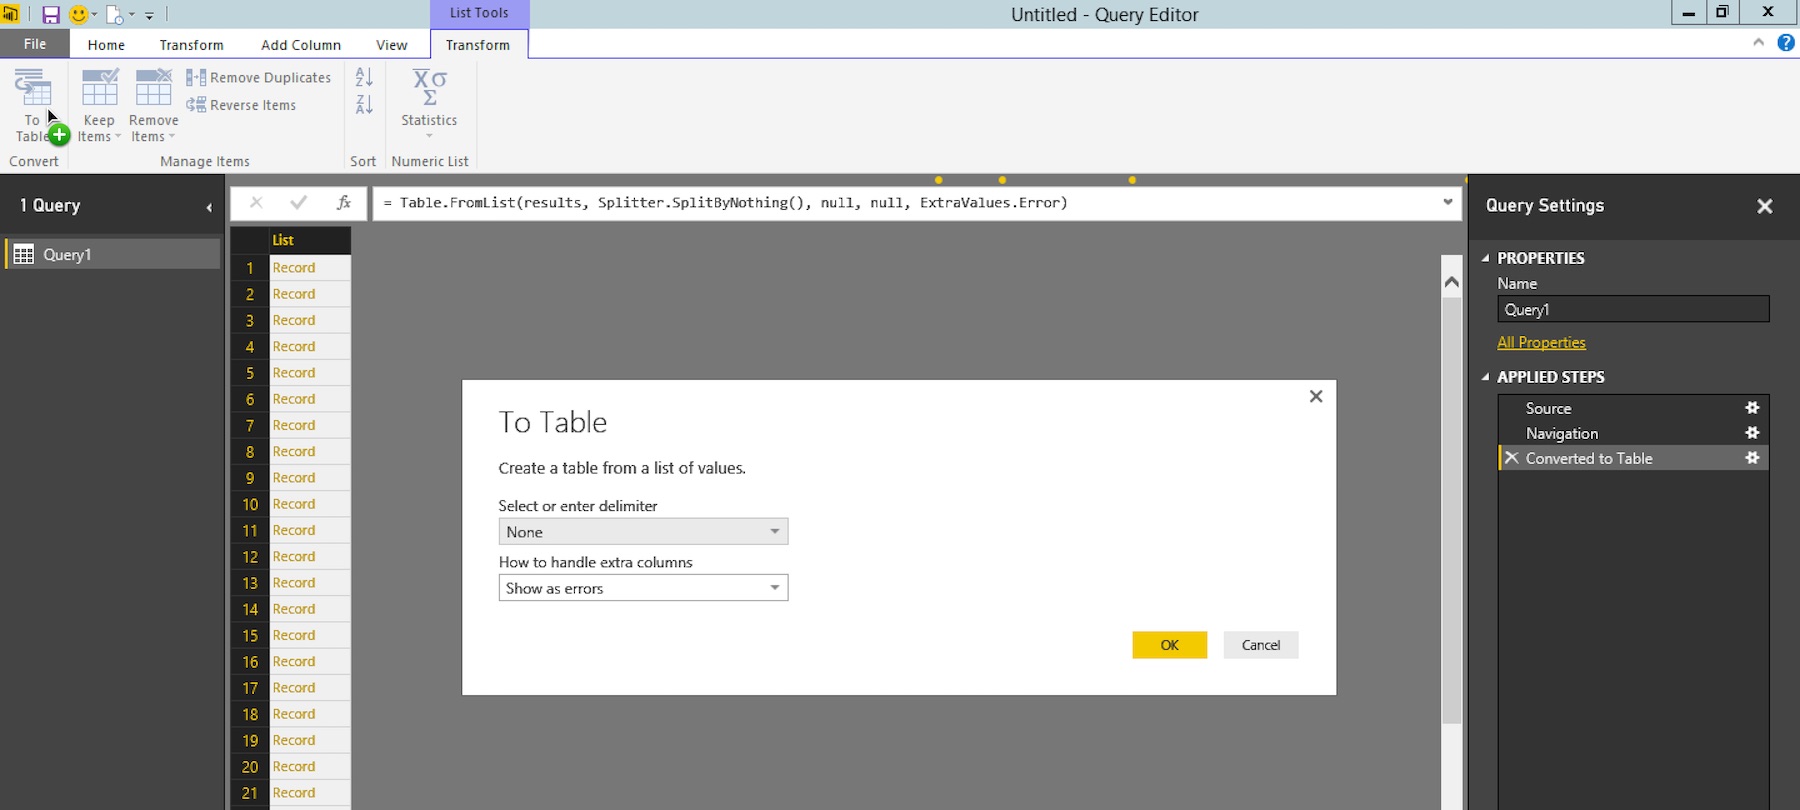
- A continuación, haga clic en el pequeño icono "dividir" en la parte superior de la columna en la cuadrícula de una sola columna para dividir los atributos en JSON en columnas separadas en la tabla.
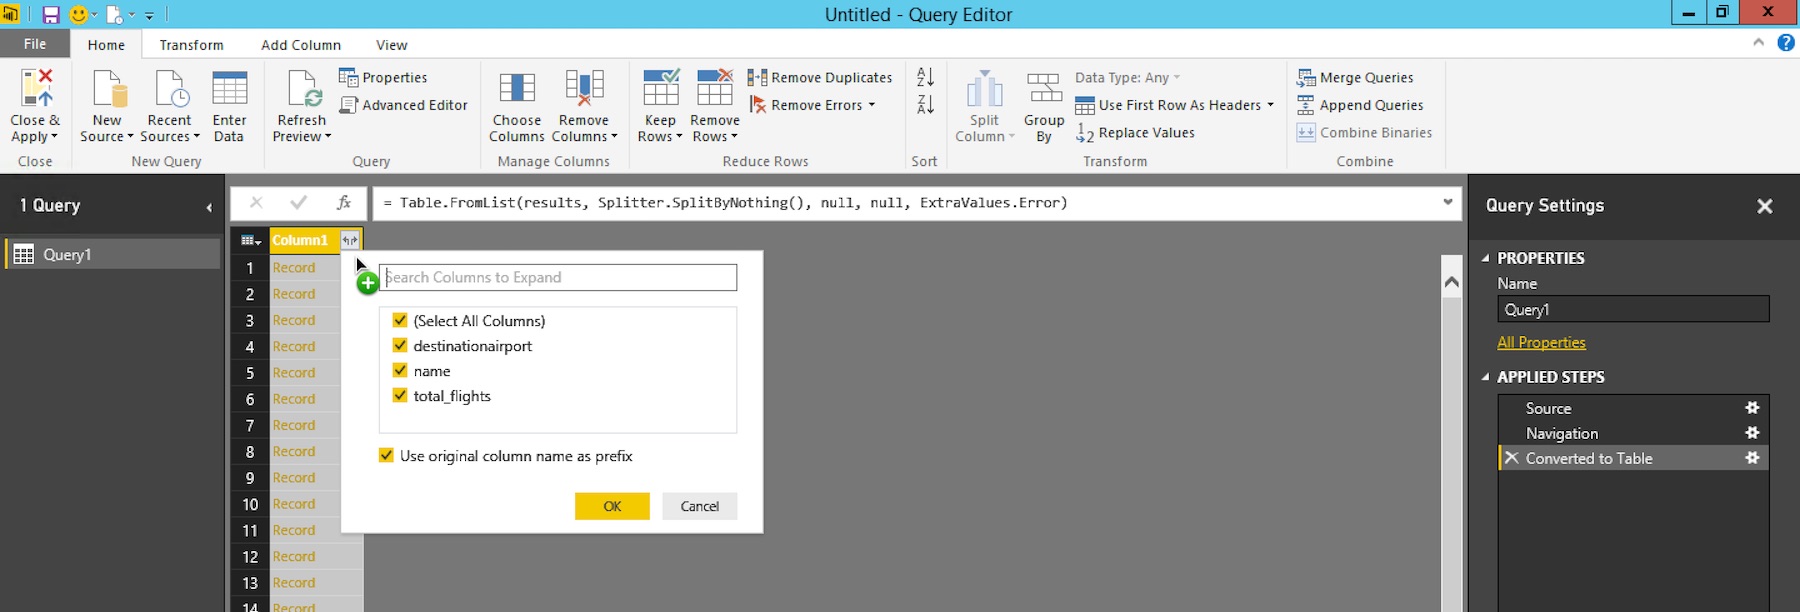
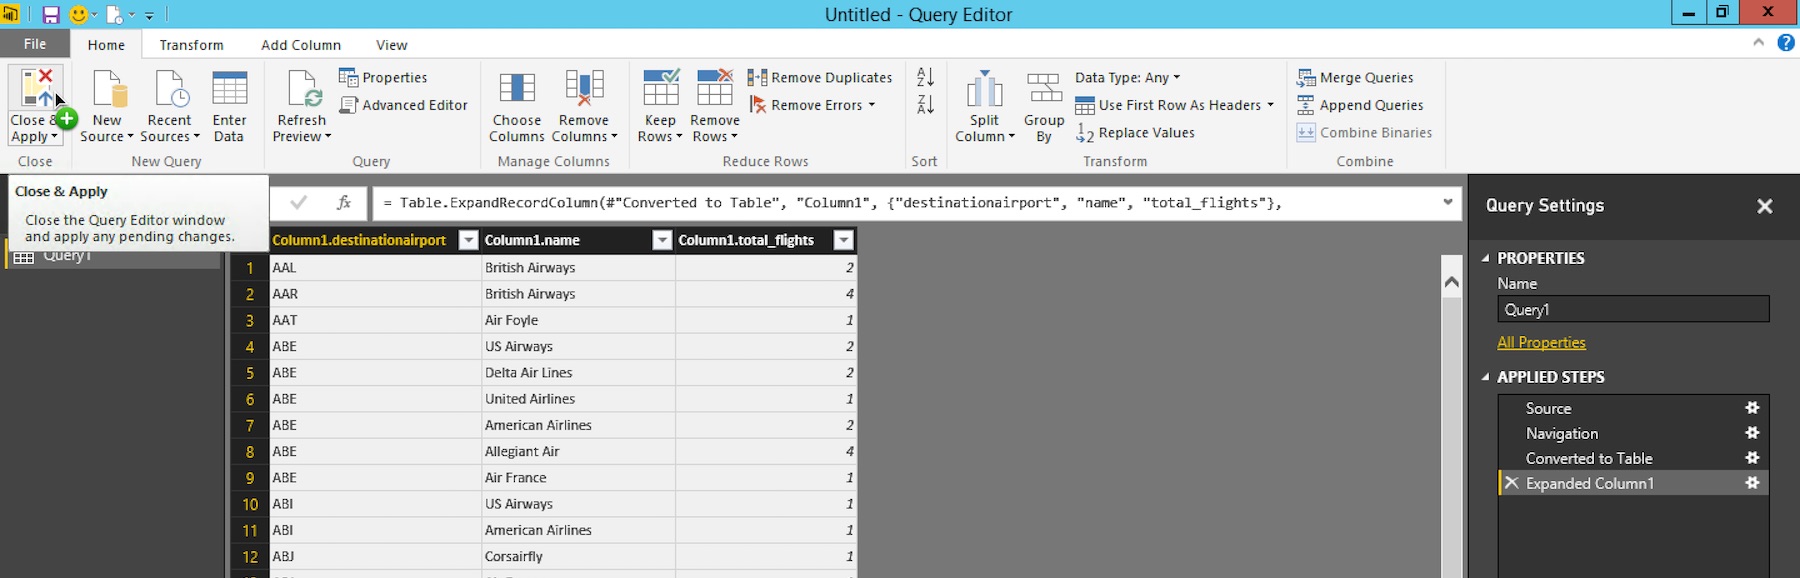
- Una vez que haya hecho clic en Aceptar, este es el aspecto que debería tener la transformación de datos completada... Simplemente haga clic en "Cerrar y aplicar" en la esquina superior izquierda
#4 Visualize Data in PowerBI:
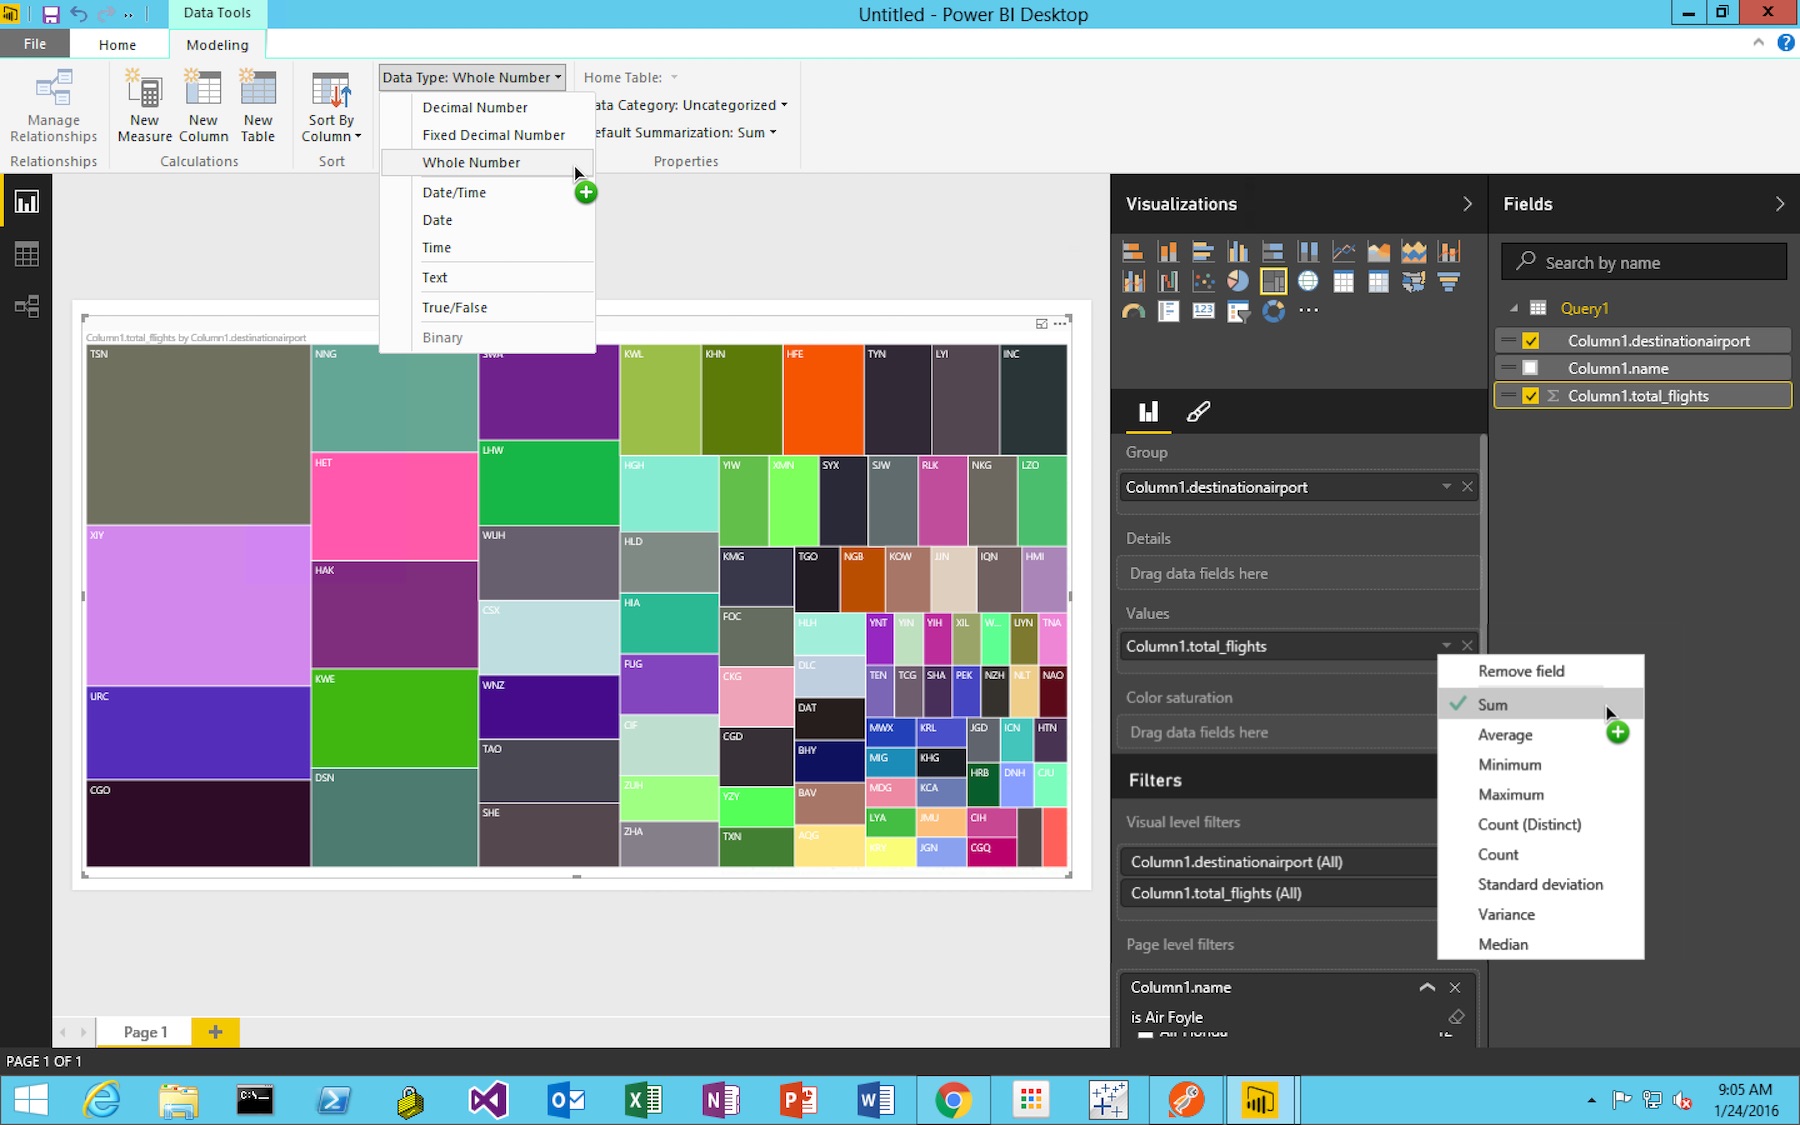
I like to use the TreeMap visualization for displaying the most popular destinations for each airline. To get there,
- Drag “Column1.destinationairport” under Grupo
- Drag “Column1.total_flights” to Values.
- Drag “Column1.name” to Page Level Filters and expand the field to filter on “Air Foyle”.
You will also modify the data type for total_flights. To get there, there are 2 more clicks. Follow the Green Plus on the figure below.
- Change the data type for column total_flights to “Whole Number”.
- Change the Aggregation on total_flights to “Sum”.
And you are done!.
I also want to mention that you can use ODBC/JDBC to connect to Couchbase Server data as well. Here is the link to download free Controladores ODBC y JDBC para Couchbase Server.
However… What I am seeing in todays world is, majority of the new data that is generated and stored is in JSON. So The new data visualization platforms like PowerBI, are adding powerful support around JSON. PowerBI has done a great job making this super easy to work with data in Couchbase Server without and ODBC driver.
Feliz pirateo.
cihan biyikoglu - director de gestión de productos