Category: Monitoring

Monitor Couchbase Sync Gateway with Prometheus and Grafana
Learn how to use Prometheus, an open source platform for monitoring Couchbase Sync Gateway nodes and Grafana for visualizing the stats.
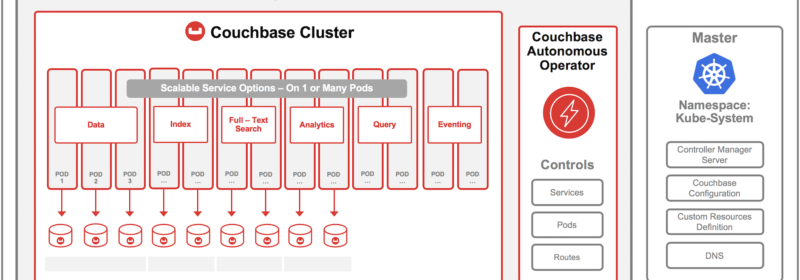
Couchbase Autonomous Operator & IBM Cloud Kubernetes Service
Learn more about the IBM Cloud kunernetes service. How to get start with Couchbase Autonomous Operator on IBM Cloud Kubernetes Service.

Couchbase Monitoring Integration with Prometheus and Grafana
Check out detailed instructions on how to install and configure Couchbase Exporter, Prometheus & Grafana in order to monitor multiple Couchbase clusters.
Top Posts
- PatientIQ: Building a Patient 360 on Couchbase
- Data Modeling Explained: Conceptual, Physical, Logical
- Data Analysis Methods: Qualitative vs. Quantitative Techniques
- What are Embedding Models? An Overview
- Speed, Context, and Savings: Mastering Caching in the Capella AI...
- Application Development Life Cycle (Phases and Management Models)
- Build a Celebrity Look-Alike App With Multimodal Vector Search an...
- Filtered ANN Search With Composite Vector Indexes (Part 4)
- What Is Data Analysis? Types, Methods, and Tools for Research