Santa Clara, Calif., – June 8, 2022 – Couchbase, Inc. (NASDAQ: BASE), provider of a leading modern database for enterprise applications, today announced financial results for its first quarter ended April 30, 2022.
“We delivered a strong first quarter exceeding the high end of our guidance on all metrics, highlighted by the third straight quarter of accelerating ARR growth,” said Matt Cain, President and CEO of Couchbase. “Couchbase Capella is continuing to gain momentum and customer feedback has been positive. We are confident that our expansive and differentiated product portfolio will continue to be at the forefront of our customers’ digital transformation initiatives.”
- Revenue: Total revenue for the quarter was $34.9 million, an increase of 25% year-over-year. Subscription revenue for the quarter was $32.0 million, an increase of 21% year-over-year.
- Annual recurring revenue (ARR): Total ARR as of April 30, 2022 was $139.7 million, an increase of 27% year-over-year, or 31% on a constant currency basis. See the section titled “Key Business Metrics” below for details.
- Gross margin: Gross margin for the quarter was 86.7%, compared to 87.9% for the first quarter of fiscal 2022. Non-GAAP gross margin for the quarter was 87.3%, compared to 88.0% for the first quarter of fiscal 2022. See the section titled “Use of Non-GAAP Financial Measures” and the tables titled “Reconciliation of GAAP to Non-GAAP Results” below for details.
- Loss from operations: Loss from operations for the quarter was $19.0 million, compared to $14.1 million for the first quarter of fiscal 2022. Non-GAAP operating loss for the quarter was $13.4 million, compared to $12.3 million for the first quarter of fiscal 2022.
- Cash flow: Cash flow used in operating activities for the quarter was $8.6 million, compared to $3.2 million in the first quarter of fiscal 2022. Capital expenditures were $0.8 million during the quarter, leading to negative free cash flow of $9.4 million, compared to negative free cash flow of $3.4 million in the first quarter of fiscal 2022.
- Remaining performance obligations (RPO): RPO as of April 30, 2022 was $169.0 million, an increase of 68% year-over-year.
- Announced the Couchbase Capella DBaaS offering on Google Cloud. Customers now have more flexibility on where to deploy Capella, improving alignment with applications and supporting hybrid and multi-cloud strategies from a single platform with price performance superior to competitors.
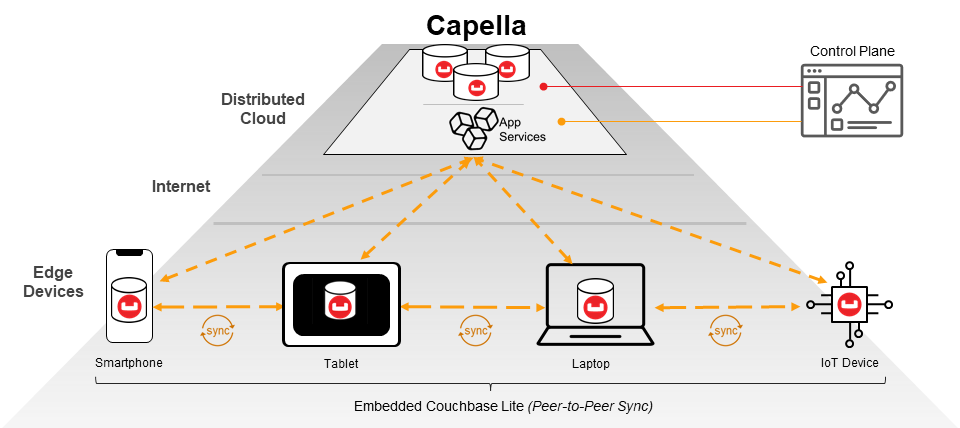
- Announced that Couchbase Capella manages and fully hosts a backend for mobile and IoT applications called Capella App Services. The enhanced offering makes it easier for developers to design and deploy fast and resilient mobile applications that seamlessly sync data between the cloud and connected devices. Now as a fully managed service, development teams can save time, effort and resources by streamlining setup configuration, synchronization and ongoing backend services management.
- Announced version 7.1 of Couchbase Server, which delivers incredible advancements in performance, storage capacity and workload breadth, including expanded operational analytics support with direct Tableau integration – all while dramatically reducing deployment cost. With Couchbase Server 7.1, enterprise architects and development teams significantly reduce the cost of building and running applications while gaining compelling operational efficiency.
- Granted an additional U.S. patent for a novel approach to optimizing document-oriented database queries on arrays. This is Couchbase’s second patent recognizing inventions in cost-based optimization for document-oriented databases and highlights the Company’s unique engineering innovation.
- Total revenue between $35.8 million and $36.0 million
- Total ARR between $142.5 million and $144.5 million
- Non-GAAP operating loss between $11.9 million and $11.7 million
- Total revenue between $147.2 million and $148.2 million
- Total ARR between $160.5 million and $164.5 million
- Non-GAAP operating loss between $55.2 million and $54.2 million
The guidance provided above is based on several assumptions that are subject to change and many of which are outside our control. If actual results vary from these assumptions, our expectations may change. There can be no assurance that we will achieve these results.
Couchbase is not able, at this time, to provide GAAP targets for operating loss for the second quarter or full year of fiscal 2023 because of the difficulty of estimating certain items excluded from non-GAAP operating loss that cannot be reasonably predicted, such as charges related to stock-based compensation expense. The effect of these excluded items may be significant.
Couchbase today announced it has promoted Huw Owen to Senior Vice President and Chief Revenue Officer, effective immediately. Mr. Owen has served as a leader of Couchbase’s international sales business for nearly four years, where he played a significant role in accelerating Couchbase’s growth, including increasing international ARR by nearly 200%. Prior to Couchbase, Mr. Owen held various international sales leadership roles at Veritas, Symantec, Lenovo and Good Technology.
“Huw’s impressive background combines scaling sales at high-growth companies with operational excellence at leading enterprise technology companies, making him well suited to take Couchbase to the next level of growth,” said Mr. Cain. “Huw is an ideal successor to step into the CRO role and I am excited to welcome him to our world class management team. I’d like to thank Denis Murphy for his many contributions to Couchbase and we wish him well in his future endeavors.”
Couchbase will host a conference call and webcast at 2:00 p.m. Pacific Time (5:00 p.m. Eastern Time) on Wednesday, June 8, 2022 to discuss its financial results and business highlights. To access this conference call, dial (888) 660-1027 from the United States and Canada or (409) 231-2719 internationally with conference ID: 9493179. The live webcast and a webcast replay of the conference call can be accessed from the investor relations page of Couchbase’s website at investors.couchbase.com.
At Couchbase, we believe data is at the heart of the enterprise. We empower developers and architects to build, deploy and run their most mission-critical applications. Couchbase delivers a high-performance, flexible and scalable modern database that runs across the data center and any cloud. Many of the world’s largest enterprises rely on Couchbase to power the core applications their businesses depend on. For more information, visit www.couchbase.com.
Couchbase has used, and intends to continue using, its investor relations website and the corporate blog at blog.couchbase.com to disclose material non-public information and to comply with its disclosure obligations under Regulation FD. Accordingly, you should monitor our investor relations website and the corporate blog in addition to following our press releases, SEC filings and public conference calls and webcasts.
In addition to our financial information presented in accordance with GAAP, we believe certain non-GAAP financial measures are useful to investors in evaluating our operating performance. We use certain non-GAAP financial measures, collectively, to evaluate our ongoing operations and for internal planning and forecasting purposes. We believe that non-GAAP financial measures, when taken together with the corresponding GAAP financial measures, may be helpful to investors because they provide consistency and comparability with past financial performance and meaningful supplemental information regarding our performance by excluding certain items that may not be indicative of our business, results of operations or outlook. Non-GAAP financial measures are presented for supplemental informational purposes only, have limitations as analytical tools and should not be considered in isolation or as a substitute for financial information presented in accordance with GAAP and may be different from similarly-titled non-GAAP financial measures used by other companies. In addition, other companies, including companies in our industry, may calculate similarly-titled non-GAAP financial measures differently or may use other measures to evaluate their performance, all of which could reduce the usefulness of our non-GAAP financial measures as tools for comparison. Investors are encouraged to review the related GAAP financial measures and the reconciliation of these non-GAAP financial measures to their most directly comparable GAAP financial measures (provided in the financial statement tables included in this press release), and not to rely on any single financial measure to evaluate our business.
Non-GAAP gross profit, non-GAAP gross margin, non-GAAP operating loss, non-GAAP operating margin, non-GAAP net loss attributable to common stockholders and non-GAAP net loss per share attributable to common stockholders: We define these non-GAAP financial measures as their respective GAAP measures, excluding expenses related to stock-based compensation expense and employer taxes on employee stock transactions. We use these non-GAAP financial measures in conjunction with GAAP measures to assess our performance, including in the preparation of our annual operating budget and quarterly forecasts, to evaluate the effectiveness of our business strategies and to communicate with our board of directors concerning our financial performance.
Beginning with the first quarter of fiscal 2023, we have excluded employer payroll taxes on employee stock transactions, which is a cash expense, from our non-GAAP results. These payroll taxes have been excluded from our non-GAAP results because they are tied to the timing and size of the exercise or vesting of the underlying equity awards, and the price of our common stock at the time of vesting or exercise may vary from period to period independent of the operating performance of our business. Prior period non-GAAP financial measures have not been adjusted to reflect this change, and the effect of this change is not material for any period previously presented.
Free cash flow: We define free cash flow as cash used in operating activities less purchases of property and equipment, which includes capitalized internal-use software costs. We believe free cash flow is a useful indicator of liquidity that provides our management, board of directors and investors with information about our future ability to generate or use cash to enhance the strength of our balance sheet and further invest in our business and pursue potential strategic initiatives.
Please see the reconciliation tables at the end of this press release for the reconciliation of GAAP and non-GAAP results.
Key Business Metrics
We review a number of operating and financial metrics, including ARR, to evaluate our business, measure our performance, identify trends affecting our business, formulate business plans and make strategic decisions.
We define ARR as of a given date as the annualized recurring revenue that we would contractually receive from our customers in the month ending 12 months following such date. ARR also includes revenue from consumption-based cloud credits of Couchbase Capella products. ARR for Couchbase Capella products is calculated by annualizing the prior 90 days of actual consumption, assuming no increases or reductions in usage.
Based on historical experience with customers, we assume all contracts will be automatically renewed at the same levels unless we receive notification of non-renewal and are no longer in negotiations prior to the measurement date. ARR excludes revenue derived from the use of cloud products only based on on-demand arrangements and services revenue. Although we seek to increase ARR as part of our strategy of targeting large enterprise customers, this metric may fluctuate from period to period based on our ability to acquire new customers and expand within our existing customers. We believe that our ARR is an important indicator of the growth and performance of our business. We updated our definition of ARR beginning in the first quarter of fiscal 2023 to include revenue from consumption-based cloud credits of Couchbase Capella by annualizing the prior 90 days of actual consumption, assuming no increases or reductions in usage. ARR for periods prior to the first quarter of fiscal 2023 has not been adjusted to reflect this change as it is not material to any period previously presented.
We also attempt to represent the changes in the underlying business operations by eliminating fluctuations caused by changes in foreign currency exchange rates within the current period. We calculate constant currency growth rates by applying the applicable prior period exchange rates to current period results.
Forward-Looking Statements
This press release contains “forward-looking” statements within the meaning of the Private Securities Litigation Reform Act of 1995 that are based on management’s beliefs and assumptions and on information currently available to management. Forward-looking statements include, but are not limited to, quotations of management, the section titled “Financial Outlook” above and statements about Couchbase’s market position, strategies and potential market opportunities. Forward-looking statements generally relate to future events or our future financial or operating performance. Forward-looking statements include all statements that are not historical facts and, in some cases, can be identified by terms such as “anticipate,” “expect,” “intend,” “plan,” “believe,” “continue,” “could,” “potential,” “remain,” “may,” “might,” “will,” “would” or similar expressions and the negatives of those terms. However, not all forward-looking statements contain these identifying words. Forward-looking statements involve known and unknown risks, uncertainties and other factors, including factors beyond our control, which may cause our actual results, performance or achievements to be materially different from any future results, performance or achievements expressed or implied by the forward-looking statements. These risks include, but are not limited to: our history of net losses and ability to achieve or maintain profitability in the future; our ability to continue to grow on pace with historical rates; our ability to manage our growth effectively; intense competition and our ability to compete effectively; cost-effectively acquiring new customers or obtaining renewals, upgrades or expansions from our existing customers; the market for our products and services being relatively new and evolving, and our future success depending on the growth and expansion of this market; our ability to innovate in response to changing customer needs, new technologies or other market requirements; our limited operating history, which makes it difficult to predict our future results of operations; the significant fluctuation of our future results of operations and ability to meet the expectations of analysts or investors; our significant reliance on revenue from subscriptions, which may decline and, the recognition of a significant portion of revenue from subscriptions over the term of the relevant subscription period, which means downturns or upturns in sales are not immediately reflected in full in our results of operations; and the impact of the ongoing COVID-19 pandemic. Further information on risks that could cause actual results to differ materially from forecasted results are included in our filings with the SEC that we may file from time to time, including those more fully described in our Annual Report on Form 10-K for the fiscal year ended January 31, 2022. Additional information will be made available in our Quarterly Report on Form 10-Q for the quarter ended April 30, 2022 that will be filed with the SEC, which should be read in conjunction with this press release and the financial results included herein. Any forward-looking statements contained in this press release are based on assumptions that we believe to be reasonable as of this date. Except as required by law, we assume no obligation to update these forward-looking statements, or to update the reasons if actual results differ materially from those anticipated in the forward-looking statements.
Investor Contact:
Edward Parker
ICR for Couchbase
IR@couchbase.com
Media Contact:
Michelle Lazzar
Couchbase Communications
CouchbasePR@couchbase.com
Couchbase, Inc.
Condensed Consolidated Statements of Operations
(in thousands, except per share data)
(unaudited)
|
Three Months Ended April 30, |
|
2022 |
2021 |
| Revenue: |
| License |
$5,007 |
$4,278 |
| Support and other |
26,974 |
22,187 |
| Total subscription revenue |
31,981 |
26,465 |
| Services |
2,872 |
1,490 |
| Total revenue |
34,853 |
27,955 |
| Cost of revenue: |
| Subscription (1) |
2,396 |
2,052 |
| Services (1) |
2,255 |
1,340 |
| Total cost of revenue |
4,651 |
3,392 |
| Gross profit |
30,202 |
24,563 |
| Operating expenses: |
| Research and development (1) |
14,421 |
12,541 |
| Sales and marketing (1) |
26,843 |
20,634 |
| General and administrative (1) |
7,926 |
5,497 |
| Total operating expenses |
49,190 |
38,672 |
| Loss from operations |
(18,988) |
(14,109) |
| Interest expense |
(25) |
(245) |
| Other income (expense), net |
(556) |
84 |
| Loss before income taxes |
(19,569) |
(14,270) |
| Provision for income taxes |
265 |
329 |
| Net loss |
$(19,834) |
$(14,599) |
| Cumulative dividends on Series G redeemable convertible preferred stock |
— |
(1,479) |
| Net loss attributable to common stockholders |
$(19,834) |
$(16,078) |
| Net loss per share attributable to common stockholders, basic and diluted |
$(0.45) |
$(2.55) |
| Weighted-average shares used in computing net loss per share attributable to common stockholders, basic and diluted |
44,265 |
6,302 |
_______________________________
Includes stock-based compensation expense as follows:
|
Three Months Ended April 30, |
|
2022 |
2021 |
| Cost of revenue—subscription |
$122 |
$27 |
| Cost of revenue—services |
94 |
22 |
| Research and development |
1,899 |
570 |
| Sales and marketing |
1,987 |
541 |
| General and administrative |
1,348 |
669 |
| Total stock-based compensation expense |
$5,450 |
$1,829 |
Couchbase, Inc.
Condensed Consolidated Balance Sheets
(in thousands)
(unaudited)
|
As of April 30, 2022 |
As of January 31, 2022 |
| Assets |
| Current assets |
| Cash and cash equivalents |
$47,672 |
$95,688 |
| Short-term investments |
153,409 |
110,266 |
| Accounts receivable, net |
24,622 |
36,696 |
| Deferred commissions |
11,548 |
11,783 |
| Prepaid expenses and other current assets |
8,014 |
8,559 |
| Total current assets |
245,265 |
262,992 |
| Property and equipment, net |
4,341 |
4,288 |
| Operating lease right-of-use assets (2) |
7,668 |
— |
| Deferred commissions, noncurrent |
8,267 |
8,243 |
| Other assets |
1,453 |
1,219 |
| Total assets |
$266,994 |
$276,742 |
| Liabilities and Stockholders’ Equity |
| Current liabilities |
| Accounts payable |
$2,640 |
$1,923 |
| Accrued compensation and benefits |
8,025 |
16,143 |
| Other accrued liabilities |
2,946 |
3,231 |
| Operating lease liabilities (2) |
2,717 |
— |
| Deferred revenue |
68,466 |
69,010 |
| Total current liabilities |
84,794 |
90,307 |
| Operating lease liabilities, noncurrent (2) |
5,627 |
— |
| Deferred revenue, noncurrent |
2,289 |
2,713 |
| Other liabilities |
— |
507 |
| Total liabilities |
92,710 |
93,527 |
| Stockholders’ equity |
| Preferred stock |
— |
— |
| Common stock |
— |
— |
| Additional paid-in capital |
536,981 |
525,392 |
| Accumulated other comprehensive loss |
(881) |
(195) |
| Accumulated deficit |
(361,816) |
(341,982) |
| Total stockholders’ equity |
174,284 |
183,215 |
| Total liabilities and stockholders’ equity |
$266,994 |
$276,742 |
_______________________________
The Company adopted ASU 2016-02, “Leases” (Topic 842) using the modified retrospective method as of February 1, 2022 and elected the transition option that allows the Company not to restate the comparative periods in its financial statements in the year of adoption.
Couchbase, Inc.
Condensed Consolidated Statements of Cash Flows
(in thousands)
(unaudited)
|
Three Months Ended April 30, |
|
2022 |
2021 |
| Cash flows from operating activities |
| Net loss |
$(19,834) |
$(14,599) |
| Adjustments to reconcile net loss to net cash used in operating activities |
| Depreciation and amortization |
739 |
708 |
| Stock-based compensation |
5,450 |
1,829 |
| Amortization of deferred commissions |
4,009 |
2,958 |
| Non-cash lease expense |
648 |
— |
| Foreign currency transaction (gains) losses |
974 |
(75) |
| Other |
198 |
34 |
| Changes in operating assets and liabilities |
| Accounts receivable |
11,781 |
18,557 |
| Deferred commissions |
(3,798) |
(2,718) |
| Prepaid expenses and other assets |
312 |
(1,898) |
| Accounts payable |
731 |
1,021 |
| Accrued compensation and benefits |
(8,112) |
(3,274) |
| Accrued expenses and other liabilities |
(71) |
(668) |
| Operating lease liabilities |
(666) |
— |
| Deferred revenue |
(968) |
(5,064) |
| Net cash used in operating activities |
(8,607) |
(3,189) |
| Cash flows from investing activities |
| Purchases of short-term investments |
(53,630) |
(1,726) |
| Maturities of short-term investments |
9,600 |
5,190 |
| Additions to property and equipment |
(799) |
(230) |
| Net cash provided by (used in) investing activities |
(44,829) |
3,234 |
| Cash flows from financing activities |
| Proceeds from exercise of stock options |
2,614 |
1,447 |
| Proceeds from issuance of common stock under ESPP |
3,525 |
— |
| Payments of deferred offering costs |
— |
(1,439) |
| Net cash provided by financing activities |
6,139 |
8 |
| Effect of exchange rate changes on cash, cash equivalents and restricted cash |
(719) |
(6) |
| Net increase (decrease) in cash, cash equivalents and restricted cash |
(48,016) |
47 |
| Cash, cash equivalents, and restricted cash at beginning of period |
96,231 |
37,840 |
| Cash, cash equivalents, and restricted cash at end of period |
$48,215 |
$37,887 |
| Reconciliation of cash, cash equivalents, and restricted cash within the consolidated balance sheets to the amounts shown above: |
| Cash and cash equivalents |
$47,672 |
$37,344 |
| Restricted cash included in other assets |
543 |
543 |
| Total cash, cash equivalents and restricted cash |
$48,215 |
$37,887 |
Couchbase, Inc.
Reconciliation of GAAP to Non-GAAP Results
(in thousands, except per share data)
(unaudited)
|
Three Months Ended April 30, |
|
2022 |
2021 |
| Reconciliation of GAAP gross profit to non-GAAP gross profit: |
| Total revenue |
$34,853 |
$27,955 |
| Gross profit |
$30,202 |
$24,563 |
| Add: Stock-based compensation expense |
216 |
49 |
| Add: Employer taxes on employee stock transactions |
2 |
— |
| Non-GAAP gross profit |
$30,420 |
$24,612 |
| Gross margin |
86.7% |
87.9% |
| Non-GAAP gross margin |
87.3% |
88.0% |
|
Three Months Ended April 30, |
|
2022 |
2021 |
| Reconciliation of GAAP operating expenses to non-GAAP operating expenses: |
| GAAP research and development |
$14,421 |
$12,541 |
| Less: Stock-based compensation expense |
(1,899) |
(570) |
| Less: Employer taxes on employee stock transactions |
(24) |
— |
| Non-GAAP research and development |
$12,498 |
$11,971 |
|
| GAAP sales and marketing |
$26,843 |
$20,634 |
| Less: Stock-based compensation expense |
(1,987) |
(541) |
| Less: Employer taxes on employee stock transactions |
(36) |
— |
| Non-GAAP sales and marketing |
$24,820 |
$20,093 |
|
| GAAP general and administrative |
$7,926 |
$5,497 |
| Less: Stock-based compensation expense |
(1,348) |
(669) |
| Less: Employer taxes on employee stock transactions |
(71) |
— |
| Non-GAAP general and administrative |
$6,507 |
$4,828 |
|
Three Months Ended April 30, |
|
2022 |
2021 |
| Reconciliation of GAAP operating loss to non-GAAP operating loss: |
| Total revenue |
$34,853 |
$27,955 |
| Loss from operations |
$(18,988) |
$(14,109) |
| Add: Stock-based compensation expense |
5,450 |
1,829 |
| Add: Employer taxes on employee stock transactions |
133 |
— |
| Non-GAAP operating loss |
$(13,405) |
$(12,280) |
| Operating margin |
(54)% |
(50)% |
| Non-GAAP operating margin |
(38)% |
(44)% |
|
Three Months Ended April 30, |
|
2022 |
2021 |
| Reconciliation of GAAP net loss attributable to common stockholders to non-GAAP net loss attributable to common stockholders: |
| Net loss attributable to common stockholders |
$(19,834) |
$(16,078) |
| Add: Stock-based compensation expense |
5,450 |
1,829 |
| Add: Employer taxes on employee stock transactions |
133 |
— |
| Non-GAAP net loss attributable to common stockholders |
$(14,251) |
$(14,249) |
| GAAP net loss per share attributable to common stockholders |
$(0.45) |
$(2.55) |
| Non-GAAP net loss per share attributable to common stockholders |
$(0.32) |
$(2.26) |
| Weighted average shares outstanding, basic and diluted |
44,265 |
6,302 |
The following table presents a reconciliation of free cash flow to net cash used in operating activities, the most directly comparable GAAP measure, for each of the periods indicated (in thousands, unaudited):
|
Three Months Ended April 30, |
|
2022 |
2021 |
| Net cash used in operating activities |
$(8,607) |
$(3,189) |
| Less: Purchases of property and equipment |
(799) |
(230) |
| Free cash flow |
$(9,406) |
$(3,419) |
| Net cash provided by (used in) investing activities |
$(44,829) |
$3,234 |
| Net cash provided by financing activities |
$6,139 |
$8 |
Couchbase, Inc.
Key Business Metrics
(in millions)
(unaudited)
|
As of |
|
Jan. 31, |
April 30, |
July 31, |
Oct. 31, |
Jan. 31, |
April 30, |
|
2021 |
2021 |
2021 |
2021 |
2022 |
2022 |
| Annual Recurring Revenue |
$107.8 |
$109.5 |
$115.2 |
$122.3 |
$132.9 |
$139.7 |
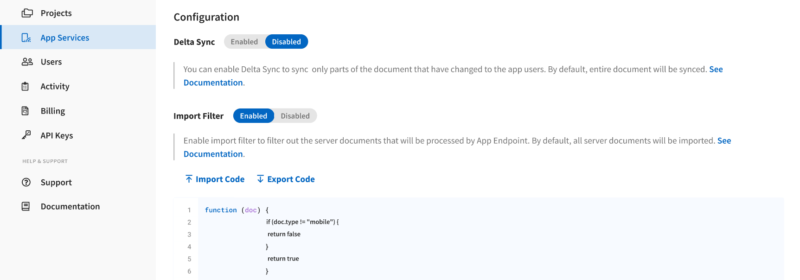
Santa Clara, Calif. – June 2, 2022 – Couchbase, Inc. (NASDAQ: BASE), a leading modern database provider for enterprise applications, today announced that Couchbase CapellaTM now fully manages and hosts a backend for mobile and IoT applications called Capella App Services. The enhanced offering makes it easier for developers to design and deploy fast and resilient mobile applications that seamlessly sync data between the cloud and devices, enabling applications to work regardless of whether they are online or offline. Now as a fully managed service, development teams can save time, effort and resources by streamlining setup configuration, synchronization and ongoing backend services management.
“Mobile capabilities are a key component for our customers’ modern applications, and we selected Couchbase specifically because it is the only database that can meet our needs for distributed offline-first mobile apps, performance and scale,” said Daniele Angeli, CEO and founder of MOLO17. “Now with Capella App Services, we get a fully managed cloud database along with managed mobile sync services. This new innovation accelerates our development and helps us use our resources more efficiently to ultimately deliver the best mobile applications to our customers.”
Without built-in, robust bi-directional synchronization, developers have to design and build this complex capability themselves to prevent mobile applications from suffering from incorrect or lost data, which could lead to frustrated application end-users, delayed operations and additional costs. Reliability is a core attribute of today’s modern applications and must be powered by a database that can support backend app services such as synchronization to maintain data integrity and consistency, producing applications that can be depended on for business-critical use cases that require high availability, security, and speed.
“Organizations need a database that can meet modern performance demands; with Capella we are uniquely positioned to significantly improve flexibility, deliver distributed and mobile experiences and drive down the total cost of ownership for customers,” said Scott Anderson, senior vice president of Product Management at Couchbase. “The number one request we receive is to add our unmatched mobile services to Capella. By unifying the entire Couchbase product offering under Capella, we are delivering all of Couchbase as-a-service with a highly competitive cloud offering that makes it easier for developers to build the next great mobile and IoT applications.”
Integrating mobile capabilities into Capella means that customers get the best of Couchbase as-a-service:
- Easy to build for developers: Capella is a one-stop-shop for developers, who can leverage SQL, SDKs and extensive platform and language support to build fast and resilient mobile apps that seamlessly sync from the cloud to edge devices, while delivering offline-first data access, peer-to-peer syncing and automatic data conflict resolution.
- Easy to manage for architects: Deploy and manage both the DBaaS and Mobile sync services through a single easy-to-use interface. App Services connect to edge and mobile devices, facilitating data synchronization and making it easier for customers to manage their application backend from the cloud tothe edge.
- More mobile use cases: Managing the synchronization gateway through Capella App Services dramatically expands the kinds of business-to-employee and business-to-consumer application use cases that Capella can support such as gaming, field employee support and customer experience.
Capella App Services for Mobile Sync
Couchbase Capella App Services is available now in private beta for customers. Please contact a Couchbase sales representative for more details.
Further Capella Innovation by Extending to Google Cloud
Additionally, today Couchbase announced that it has extended Capella to Google Cloud, adding multicloud capabilities to its high-performance and easy-to-use DBaaS. Developers get maximum flexibility across cloud service providers and can build and scale applications on Google’s expansive cloud infrastructure with just a few clicks.
Additional Resources
- Read this blog post for more information about Capella and Mobile App Services
- Start a free trial of Capella now by clicking here
- Watch these videos to find out how Emirates, PepsiCo and Louis Vuitton built high performing modern apps that are always on and always connected with Couchbase Mobile
SANTA CLARA, Calif., June 2, 2022 – Couchbase, Inc. (NASDAQ: BASE), provider of a leading modern database for enterprise applications, today announced its Couchbase CapellaTM Database-as-a-Service (DBaaS) offering now available on Google Cloud. Customers now have more flexibility on where to deploy Capella, improving alignment with applications and supporting hybrid and multi-cloud strategies from a single platform at price performance that is superior to competitors.
“Accelerating the development and deployment of database applications has become increasingly important to companies that are digitally transforming their businesses,” said Ritika Suri, director of Technology Partnerships, Google Cloud. “By making its Capella offering available on Google Cloud’s secure and flexible global infrastructure, Couchbase is providing customers with a cost-effective way to speed up the development of their applications.”
Capella is a fully managed DBaaS that offloads database management, reduces costs and delivers database flexibility for developers and performance at scale for enterprise applications. For developers and across organizations, the familiarity of SQL as the query language of Capella dramatically lowers the learning and usage curve.
Couchbase Capella customer benefits include:
- Easy as SQL. SQL users can develop against Couchbase Capella without learning another query language and they can deploy in just a few clicks. One management pane simplifies multi-cluster, multi-region and multi-cloud operations.
- Develop with agility across use cases. Developers get multi-model capabilities (document, key-value, full text search, analytics) and data structure flexibility, allowing them to develop applications for operational and transactional workloads in one platform. Users can pick one of ten SDKs with their preferred programming language.
- Premium performance and cost efficiency at scale. Couchbase Capella’s unique real-time, memory-first architecture ensures millisecond responses for highly interactive and personalized applications while the price performance keeps improving as users scale.
- Multi-cloud. By extending to Google Cloud, customers can easily build and run applications across cloud service providers with just a few clicks.
“With Capella on Google Cloud, we offer flexible multi-model access and data structure capabilities that allow customers to develop with agility for an even broader set of use cases, all from a single vendor,” said Scott Anderson, senior vice president of Product Management and Business Operations at Couchbase. “Our customers look to Couchbase to help make their modernization strategies a reality and we’ve seen strong demand from our customers for Capella on Google Cloud. Extending Couchbase Capella to Google Cloud means we can accelerate growth and product innovation at scale for even more customers, giving them the flexibility to go across cloud service providers.”
Couchbase Capella is now available on Google Cloud. Start a free trial today by clicking here to see how easy it is to be up and running in just minutes with Couchbase.
Additional Resources
- For more information about Couchbase Capella on Google Cloud, read this blog post
- To find out about all the ways Couchbase can be deployed in any cloud, visit this page
- Read the new Couchbase Cloud Evolution Report here

SANTA CLARA, Calif., June 2, 2022 – Couchbase, Inc. (NASDAQ: BASE), provider of a leading modern database for enterprise applications, today released research showing that factors such as inflexible pricing plans, management tools that don’t give the level of control users need, and data not being stored where it needs to be, are adding more than 35% to enterprise cloud costs. With a typical enterprise spending more than $33 million a year on cloud services according to the research, this represents more than $8.75 million that could be saved or spent elsewhere if enterprises and cloud service providers can solve these challenges.
The survey of 650 senior IT decision-makers found:
-
Cloud services are not meeting expectations, and are adding to complication and cost: More than one-third (36%) of enterprises said cloud services adopted in the last three years had not met expectations, while 56% said past cloud decisions had made digital transformation projects more difficult in 2021, and 48% more expensive.
-
Contributors to overspending: The factors adding to costs included not having enough insight into spend or ways to optimize costs; the need to improve security and compliance functionality; inflexible pricing plans that don’t give enterprises what they need in a single package; management tools that don’t give the control needed; data not being stored where needed to meet regulatory or performance requirements; and vendor lock-in, meaning enterprises cannot use the specific cloud infrastructure they want.
-
Enterprises are struggling against service limitations: 61% of enterprises have had to restrict their digital transformation ambitions because of challenges with cloud services; while 58% have chosen cloud services that did not give the ability to scale the business to meet demand.
-
Cloud momentum is unstoppable: 95% of enterprises said that increased movement of infrastructure to the cloud is “inevitable.”
“There’s no denying the impact of the cloud, from giving large enterprises increased scalability and agility, to giving smaller enterprises access to services and applications they could never implement in-house,” said Ravi Mayuram, chief technology officer of Couchbase. “Businesses believe they are getting what they need, or else we wouldn’t be seeing this seemingly unstoppable momentum. The question is whether they could be getting even more – $8.75 million is too much to just be a cost of doing business. If enterprises raise their expectations and service providers address inefficiencies, they could open up new opportunities for digital transformation – or simply reduce their costs.”
Despite the costs and challenges they face, enterprises are optimistic about the cloud. Almost every respondent is confident that their cloud services are giving them the levels of security, availability, performance, cost-effectiveness, control, scalability, and compliance they need.
This is matched by growing cloud spend. By 2025, enterprises want 58% of their IT spend to be in the public cloud and said that they are currently more than halfway (56%) toward meeting that goal. Their reasoning is clear. Asked specifically about Databases-as-a-Service (DBaaS), enterprises said that cloud services can offer better uptime SLAs than their in-house team, and that they can better budget if they switch to consumption-based pricing. This, in turn, would allow them to reallocate resources currently used to manage their database infrastructure to areas where it could be spent better.
Asked to identify their top concerns around new cloud infrastructure, security of data was identified by 43% of respondents, followed by managing data in the cloud (33%) and future-proofing to meet future digital needs (31%), while 30% are concerned about keeping costs under control in the future.
“If costs and concerns keep mounting, we will see more organizations struggling to meet their overall business ambitions,” continued Mayuram. “The key to a lot of these concerns, and the additional costs enterprises are facing, is sprawl. The more control cloud customers have over their data, including where it is stored and how it is managed, the more confident they will be that it is secure, that their services are future-proofed, and that they have costs under control.
We know there’s no putting the cloud genie back in the bottle, and nor should enterprises want to. Instead, we need to ensure it lives up to every expectation.”
Read the full Couchbase report here.
SANTA CLARA, CALIF. – May 27, 2022 – Couchbase, Inc. provider of a leading modern database for enterprise applications, has established National Cloud Database Day as a registered holiday to be celebrated annually on June 1.
What
-
National Cloud Database Day celebrates engineers, software teams, administrators, developers and those involved in the delivery of software that have adopted and rely on cloud databases to solve problems for enterprises. It recognizes the value and agility cloud databases enable as the backbone of modern applications across all industries.
Why:
-
Industry analysts are forecasting that cloud database management service revenue will account for 50% of the total database market revenue this year.
-
The growth of digital business, mobile devices, flexible agile development and microservices have made legacy databases obsolete. Today, companies rely on cloud databases to keep business-critical applications running across almost every sector, from transportation and package delivery, retail and banking, streaming and media, healthcare and entertainment, supply chain and back office, and so much more.
When:
Where:
How to Celebrate:
-
Promote projects and innovations enabled by cloud databases on social media to bring awareness to National Cloud Database Day; use the hashtags #NationalCloudDatabaseDay and #CloudDBday and include the official graphic
-
Write a blog post or article about innovative applications that are powered by cloud databases
Throughout the day on June 1, Couchbase will be sharing Twitter polls for users to interact with and learn about cloud databases. Follow Couchbase on Twitter to get involved!
Additional Resources
-
Register for Couchbase’s Global Roadshow: Application Modernization Summit here
-
Read more about how customers are modernizing with Couchbase here
-
Start a free trial of Capella here and see how easy it is to get up and running with Couchbase-as-a-service in just a few clicks
SANTA CLARA, CALIF. – May 17, 2022 – Couchbase, Inc. (NASDAQ: BASE), provider of a leading modern database for enterprise applications, today announced that it will report financial results for its fiscal first quarter ended April 30, 2022 on Wednesday, June 8, 2022 after market close.
Couchbase will host a conference call and webcast at 2:00 p.m. Pacific Time (or 5:00 p.m. Eastern Time) on the same day to discuss its financial results. To access this conference call, dial (888) 660-1027 from the United States or (409) 231-2719 internationally with conference ID: 9493179. The live webcast and a webcast replay of the conference call can be accessed from the investor relations page of Couchbase’s website at investors.couchbase.com.
Investor Contact:
Edward Parker
ICR, Inc.
IR@couchbase.com
Media Contact:
Michelle Lazzar
Couchbase, Inc.
couchbasePR@couchbase.com
SANTA CLARA, CALIF. – May 10, 2022 – Couchbase, Inc. (NASDAQ: BASE), a leading modern database provider for enterprise applications, announced version 7.1 of Couchbase Server. Available today, the new release delivers incredible advancements in performance, storage capacity and workload breadth, including expanded operational analytics support with direct Tableau integration–all while dramatically reducing deployment cost. With Couchbase Server 7.1, enterprise architects and development teams significantly reduce the cost of building and running applications while gaining compelling operational efficiency.
“More organizations are experiencing the drawbacks of deploying first-generation cloud architectures, and one of the main disadvantages is the cost of cloud instance sprawl,” said Ravi Mayuram, chief technology officer at Couchbase. “As a result, companies today are looking to consolidate infrastructure resources to spend less and reduce the complexity of their data architectures with multimodel databases. This release does that and more, helping to shrink cluster sizes while providing higher throughput, larger data capacity and easier access to active analytics through Tableau. With Couchbase Server 7.1, modern applications can become both smarter and more cost-efficient.”
The new Couchbase Server 7.1 enhancements provide better performance while reducing the number of cluster nodes required to handle larger volumes of data. It delivers an extremely affordable total cost of ownership compared to other multimodel NoSQL alternatives. Customers will benefit from the following:
- Improved cluster efficiency and performance which lowers deployment costs by introducing a new high-density storage engine that increases node storage capacity by more than 3x, increases write throughput by 4x and lowers memory consumption by 10x. Customers can dramatically drive down cluster costs, size and complexity. This means that existing clusters can become up to 10 times more efficient while handling three times more data. In addition, new clusters can start smaller using lower commodity hardware instances, and grow more efficiently, giving customers the ability to be significantly more cost-efficient in supporting classic database use cases.
- Increased support for conventional database capabilities such as improved backup service for better data availability and JavaScript-based user-defined functions (UDFs) for better separating of functional processing from storage management.
- Expanded support for ARM processors, offering higher performance while lowering power consumption and reducing cloud operating expenses. Customers can develop containerized, Couchbase-powered applications on local Apple M1 systems and easily deploy them to AWS Graviton-based instances. This practice can further reduce customer infrastructure costs by up to 50%.
“Some database companies only offer specialized databases for very specific workloads. Couchbase has significantly reduced the divide between relational and NoSQL data by designing a platform that enables JSON-based transactional and analytical data to reside in a single system,” said Carl Olofson, research vice president of data management software at IDC. “While Couchbase is a NoSQL-based system, the 7.1 release advances its ability to provide customers with a multimodel database capable of both transactions and analytics with flexibility, scalability and performance while reducing deployment costs.”
Enhanced Operational Analytics with Direct Tableau Integration
Modern organizations require operational processing of transactions, interactions and analytics upon active data to meet the intelligence and performance demands of their global business. A new direct Tableau connector enables operational analytics in Couchbase, providing the easiest and most effective approach to analyzing active JSON data within its operational data store, without interfering with operational performance and without moving the data. Users can create tabular views using SQL++, develop visualizations in Tableau and perform rich, interactive analyses to derive insight from active operational data.
“Integrating Tableau’s leading analytics platform with Couchbase’s leading modern database will provide customers with an easy way to see and understand their data,” said Brian Matsubara, vice president of global technology alliances at Tableau. “Together, we can provide fast and easy visualization of our customers’ Couchbase JSON data using a new connector to help make it easier to access enterprise data in near real-time. Customers can now create tabular views in Couchbase, develop visualizations and dashboards in Tableau and perform rich interactive analyses to derive even more insight from operational analytics.”
Couchbase Server 7.1 is available today and can be downloaded here.
Additional Resources:
- For more information about what’s new in Couchbase Server 7.1, read this blog post.
- Register for a webinar with guest analyst Boris Evelson from Forrester Research in the US, EMEA or APAC time zones.
- Read more about how customers are modernizing with Couchbase here.
- Read the 5th Annual Couchbase Digital Transformation research report here.
SANTA CLARA, CALIF. – May 10, 2022 – Couchbase, Inc. (NASDAQ: BASE), provider of a leading modern database for enterprise applications, today released the results of its fifth annual survey on enterprise digital transformation. The global survey of 650 IT leaders found that, despite the challenges of the last two years, enterprises have made significant progress. Seventy-nine percent of enterprises have made significant, transformative or even revolutionary improvements to the end user experience through digital transformation over the past year, compared to 73% in 2019 and 72% in 2020. And the outlook is optimistic – on average, enterprises plan to increase their investment in digital transformation by 46% over the next 12 months.
However, enterprises still need to be aware of digital transformation challenges. Eighty-one percent of enterprises had digital transformation projects fail, suffer delays or be scaled back in the past year, at an average cost of $4.12 million. A further 82% were prevented from pursuing digital transformation projects that they wanted to implement due to factors such as a lack of resources or funds (reported by 26%), a lack of skills to deliver the project (24%) or the complexity of implementing technologies (23%).
The consequences of these failed or missed projects can be more than wasted funds. Fifty-five percent of enterprises that suffered issues with their digital transformation projects had to delay their strategic goals by three months or more, or reset them completely. Other potential consequences of failing to keep pace identified by respondents include losing valuable staff to more innovative competitors – whether in IT (41%) or other areas of the business (40%); struggling to secure finance or undergo a successful IPO (31%); or going out of business or being absorbed by a competitor (26%).
“The progress in organizations’ digital transformation ambitions over the past 12 months is clear, and there’s a bright future ahead,” said Ravi Mayuram, chief technology officer at Couchbase. “Ideally we’ll now begin to see enterprises putting into practice projects and ideas that weren’t previously considered possible. For this to become reality, organizations need to learn the lessons of the last two years and address the challenges they face, or a large proportion of that 46% increase in investment may be wasted, too. IT teams need support from across the business, together with the resources they need, and the right skills and technology to succeed. From embracing the cloud, to making the best use of data, enterprises that can make use of new technologies will be best placed to thrive.”
Lessons Learned
The past two years have had a transformative impact on IT teams. Ninety-five percent of respondents have implemented or investigated digital transformation opportunities that would not have been realistic at the end of 2019 – from hybrid working (nearly 47%) to moving to the cloud (46%), replacing legacy technology and processes (42%), changing the way the business operates (36%) and creating new business offerings (35%). Other findings included:
- 99% of enterprises say they learned lessons from the pandemic: including the importance of supporting remote and hybrid working (45%); the need for continuous investment and research in digital transformation technologies (41%); and how to better engage the wider business in digital transformation strategy (34%).
- Investment priorities are shifting compared to 2019: While security is still the top priority for enterprises, and hybrid working received an understandable boost, modernizing existing technology has fallen as a priority, while adopting new technologies has grown – suggesting enterprises recognize they need completely new, modern tools in order to face the future.
- Ways of working have changed: 88% of respondents say their digital transformation goals have fundamentally changed over the last two years; 95% have accelerated their application modernization strategies; 90% have changed the way they budget for digital transformation; and 93% say digital transformation projects over the last two years represent permanent changes to the way their business’s way of operating or working.
- End users are the focus: 88% of respondents said their digital transformation projects had been driven more by changes in user behavior than by creating new business opportunities.
“This is an exciting time for the IT industry. We are entering a period of extreme creativity, as organizations shift from digital transformation driven by reacting to outside events, such as the pandemic or competitors’ progress, to a more proactive approach driven by ideas from within the business,” continued Ravi Mayuram. “For this new creativity to work, it needs to be driven from the top. Digital transformation shouldn’t only be aligned to strategic goals. As a transformative business asset it needs to be the responsibility of, and driven by, the whole C-suite, rather than left solely in IT’s hands. If businesses can do this and put the lessons they learned from the last two years into practice, then the future looks very bright indeed.”
Read the full Couchbase report here.
SANTA CLARA, CALIF. – April 27, 2022 – Couchbase, Inc. (NASDAQ: BASE), provider of a leading modern database for enterprise applications, today announced it has been recognised as the number 57 out of 105 of the UK’s Best Medium Size Workplaces™ (2022) by Great Place to Work®, the global authority on workplace culture.
93% of UK employees say that Coucbase is a great place to work in response to Great Place to Work’s 2022 survey, an outstanding achievement compared to 57% of UK employee favorability at a typical U.S.-based company. People, values, culture and team were the most frequently cited aspects across employee reviews that led to Couchbase’s strong showing.
“At Couchbase, we pride ourselves on our culture and values which extend across our Manchester and London offices as well as those working remotely in the UK,” said Huw Owen, Vice President and General Manager of EMEA, Couchbase. “This award is a testament to our world-class UK team and we’re continually investing in hiring top talent to build on this momentum. We are looking forward to expanding our team so we can continue to develop next-generation database technology for today’s leading modern enterprises. Thank you to all our employees who helped us achieve this award.”
“Even in times of uncertainty, at Best Workplaces™ the shared mantra of ‘purpose over profit’ has stood firm,” said Benedict Gautrey, Managing Director of Great Place to Work® UK. “We’re incredibly proud to recognise the 290 companies on our list for their outstanding workplace cultures, and unwavering commitment to supporting employees so they can deliver the best strategic solutions to ever-changing business opportunities and challenges.”
A great workplace is more than perks, parties and amazing benefits. While those elements are present in many Best Workplace™ organisations, at its core a great workplace is about the level of trust that employees experience in their leaders, the level of pride they have in their jobs; and the extent to which they experience camaraderie with their colleagues.
To determine the 2022 UK’s Best Workplaces™ list, Great Place to Work® performed rigorous evaluations of hundreds of employee survey responses alongside Culture Audit™ submissions from leaders at each company. They then used these data insights to benchmark the effectiveness of companies’ employee value propositions against the culture their employees actually experience.
Those businesses who achieve the highest scores after evaluation receive Best Workplaces™ status.
About Great Place to Work®
Great Place to Work is the global authority on workplace culture. Since 1992, they have surveyed more than 100 million employees around the world and used those deep insights to define what makes a great workplace: Trust. For more information, visit www.greatplacetowork.co.uk
Media Contact:
James Kim
Couchbase Communications
couchbasePR@couchbase.com
Santa Clara, Calif., – March 9, 2022 – Couchbase, Inc. (NASDAQ: BASE), provider of a leading modern database for enterprise applications, today announced financial results for the fourth quarter and fiscal year ended January 31, 2022.
“We finished our first fiscal year as a public company with strong momentum including ARR of $132.9 million, representing 23% growth, as well as record net new ARR of $10.6 million, which was up 65% year over year,” said Matt Cain, President and CEO of Couchbase. “Looking ahead to fiscal 2023, we are excited about the opportunity to increase our momentum through our Capella database as a service offering and expanded go-to-market efforts. Modernization of applications remains a top priority for enterprises as they invest in digital transformation initiatives, and Couchbase continues to be thoughtfully architected to meet the market demand for this ongoing trend.”
Fourth Quarter Fiscal 2022 Financial Highlights
- Revenue: Total revenue for the quarter was $35.1 million, an increase of 19% year-over-year. Subscription revenue for the quarter was $32.8 million, an increase of 17% year-over-year.
- Annual recurring revenue (ARR): Total ARR as of January 31, 2022 was $132.9 million, an increase of 23% year-over-year. See the section titled “Key Business Metrics” below for details.
- Gross margin: Gross margin for the quarter was 88.2%, compared to 89.4% for the fourth quarter of fiscal 2021. Non-GAAP gross margin for the quarter was 88.7%, compared to 89.5% for the fourth quarter of fiscal 2021. See the section titled “Use of Non-GAAP Financial Measures” and the tables titled “Reconciliation of GAAP to Non-GAAP Results” below for details.
- Loss from operations: Loss from operations for the quarter was $12.7 million, compared to $8.0 million for the fourth quarter of fiscal 2021. Non-GAAP operating loss for the quarter was $9.1 million, compared to $6.7 million for the fourth quarter of fiscal 2021.
- Cash flow: Cash flows used in operating activities for the quarter were $2.7 million, compared to $6.6 million in the fourth quarter of fiscal 2021. Capital expenditures were less than $0.1 million during the quarter, leading to negative free cash flow of $2.7 million, compared to negative free cash flow of $6.6 million in the fourth quarter of fiscal 2021.
- Remaining performance obligations (RPO): RPO as of January 31, 2022 was $161.6 million, an increase of 58% year-over-year.
Full Year Fiscal 2022 Financial Highlights
- Revenue: Total revenue for the year was $123.5 million, an increase of 20% year-over-year. Subscription revenue for the year was $116.3 million, an increase of 20% year-over-year.
- Gross margin: Gross margin for the year was 88.0%, compared to 88.8% for fiscal 2021. Non-GAAP gross margin for the year was 88.4%, compared to 88.9% for fiscal 2021.
- Loss from operations: Loss from operations for the year was $56.3 million, compared to $33.1 million for fiscal 2021. Non-GAAP operating loss for the year was $45.5 million, compared to $28.2 million for fiscal 2021.
- Cash flow: Cash flows used in operating activities for the year were $41.6 million, compared to $39.2 million in fiscal 2021. Capital expenditures were $0.8 million during the year, leading to negative free cash flow of $42.4 million, compared to negative free cash flow of $42.0 million in fiscal 2021.
Recent Business Highlights
- Appointed cloud and database veteran Gopi Duddi as senior vice president of Engineering, overseeing all product development and delivery for the company. Duddi brings nearly 25 years of experience and, as a former general manager at AWS, built and supported some of the cloud service provider’s fastest growing products.
- Announced Couchbase Mobile 3, an edge-ready data platform that empowers mobile developers and edge architects to build fully native, modern applications in the cloud, at the edge and on mobile and IoT devices using the language, frameworks and platform of their choice.
- Granted a U.S. patent for cost-based optimization for document-oriented database queries, making Couchbase the only document database and cloud company to hold a patent for this novel and critical query optimization method.
- Achieved the Amazon Web Services (AWS) Outposts Ready designation, recognizing that Couchbase has demonstrated successful integration with AWS Outposts deployments. This achievement further strengthens Couchbase’s mobile and edge partner ecosystem to provide a superior experience for customers.
- Named one of the top five out of 25 highest-rated public cloud computing companies to work for in a list released by Battery Ventures with data specifically provided by Glassdoor.
Financial Outlook
For the first quarter of fiscal 2023, Couchbase expects:
- Total revenue between $32.5 million and $32.7 million
- Total ARR between $136 million and $138 million
- Non-GAAP operating loss between $16.8 million and $16.6 million
For the full fiscal year 2023, Couchbase expects:
- Total revenue between $146.5 million and $147.5 million
- Total ARR between $160 million and $164 million
- Non-GAAP operating loss between $57.2 million and $56.2 million
The guidance provided above is based on several assumptions that are subject to change and many of which are outside our control. If actual results vary from these assumptions, our expectations may change. There can be no assurance that we will achieve these results.
Couchbase is not able, at this time, to provide GAAP targets for operating income for the first quarter or full year of fiscal 2023 because of the difficulty of estimating certain items excluded from non-GAAP operating loss that cannot be reasonably predicted, such as charges related to stock-based compensation expense. The effect of these excluded items may be significant.
Conference Call Information
Couchbase will host a conference call and webcast at 2:00 p.m. Pacific Time (5:00 p.m. Eastern Time) on Wednesday, March 9, 2022 to discuss its financial results and business highlights. To access this conference call, dial (888) 660-1027 from the United States and Canada or (409) 231-2719 internationally with conference ID: 8395512. The live webcast and a webcast replay of the conference call can be accessed from the investor relations page of Couchbase’s website at investors.couchbase.com.
Use of Non-GAAP Financial Measures
In addition to our financial information presented in accordance with GAAP, we believe certain non-GAAP financial measures are useful to investors in evaluating our operating performance. We use certain non-GAAP financial measures, collectively, to evaluate our ongoing operations and for internal planning and forecasting purposes. We believe that non-GAAP financial measures, when taken together with the corresponding GAAP financial measures, may be helpful to investors because they provide consistency and comparability with past financial performance and meaningful supplemental information regarding our performance by excluding certain items that may not be indicative of our business, results of operations or outlook. Non-GAAP financial measures are presented for supplemental informational purposes only, have limitations as analytical tools and should not be considered in isolation or as a substitute for financial information presented in accordance with GAAP and may be different from similarly-titled non-GAAP financial measures used by other companies. In addition, other companies, including companies in our industry, may calculate similarly-titled non-GAAP financial measures differently or may use other measures to evaluate their performance, all of which could reduce the usefulness of our non-GAAP financial measures as tools for comparison. Investors are encouraged to review the related GAAP financial measures and the reconciliation of these non-GAAP financial measures to their most directly comparable GAAP financial measures (provided in the financial statement tables included in this press release), and not to rely on any single financial measure to evaluate our business.
Non-GAAP gross profit, non-GAAP gross margin, non-GAAP operating loss, non-GAAP operating margin, non-GAAP net loss attributable to common stockholders and non-GAAP net loss per share attributable to common stockholders: We define these non-GAAP financial measures as their respective GAAP measures, excluding expenses related to stock-based compensation expense and litigation-related expenses. We use these non-GAAP financial measures in conjunction with GAAP measures to assess our performance, including in the preparation of our annual operating budget and quarterly forecasts, to evaluate the effectiveness of our business strategies and to communicate with our board of directors concerning our financial performance.
Free cash flows: We define free cash flow as cash used in operating activities less purchases of property and equipment, which includes capitalized internal-use software costs. We believe free cash flow is a useful indicator of liquidity that provides our management, board of directors and investors with information about our future ability to generate or use cash to enhance the strength of our balance sheet and further invest in our business and pursue potential strategic initiatives.
Please see the reconciliation tables at the end of this press release for the reconciliation of GAAP and non-GAAP results.
Key Business Metrics
We review a number of operating and financial metrics, including ARR, to evaluate our business, measure our performance, identify trends affecting our business, formulate business plans and make strategic decisions.
We define ARR as of a given date as the annualized recurring revenue that we would contractually receive from our customers in the month ending 12 months following such date.
Based on historical experience with customers, we assume all contracts will be automatically renewed at the same levels unless we receive notification of non-renewal and are no longer in negotiations prior to the measurement date. ARR excludes revenue from on-demand arrangements. Although we seek to increase ARR as part of our strategy of targeting large enterprise customers, this metric may fluctuate from period to period based on our ability to acquire new customers and expand within our existing customers. We believe that our ARR is an important indicator of the growth and performance of our business.
Forward-Looking Statements
This press release contains “forward-looking” statements within the meaning of the Private Securities Litigation Reform Act of 1995 that are based on management’s beliefs and assumptions and on information currently available to management. Forward-looking statements include, but are not limited to, quotations of management, the section titled “Financial Outlook” above and statements about Couchbase’s market position, strategies and potential market opportunities. Forward-looking statements generally relate to future events or our future financial or operating performance. Forward-looking statements include all statements that are not historical facts and, in some cases, can be identified by terms such as “anticipate,” “expect,” “intend,” “plan,” “believe,” “continue,” “could,” “potential,” “remain,” “may,” “might,” “will,” “would” or similar expressions and the negatives of those terms. However, not all forward-looking statements contain these identifying words. Forward-looking statements involve known and unknown risks, uncertainties and other factors, including factors beyond our control, which may cause our actual results, performance or achievements to be materially different from any future results, performance or achievements expressed or implied by the forward-looking statements. These risks include, but are not limited to: our history of net losses and ability to achieve or maintain profitability in the future; our ability to continue to grow on pace with historical rates; our ability to manage our growth effectively; intense competition and our ability to compete effectively; cost-effectively acquiring new customers or obtaining renewals, upgrades or expansions from our existing customers; the market for our products and services being relatively new and evolving, and our future success depending on the growth and expansion of this market; our ability to innovate in response to changing customer needs, new technologies or other market requirements; our limited operating history, which makes it difficult to predict our future results of operations; the significant fluctuation of our future results of operations and ability to meet the expectations of analysts or investors; our significant reliance on revenue from subscriptions, which may decline and, the recognition of a significant portion of revenue from subscriptions over the term of the relevant subscription period, which means downturns or upturns in sales are not immediately reflected in full in our results of operations; and the impact of the ongoing COVID-19 pandemic. Further information on risks that could cause actual results to differ materially from forecasted results are included in our filings with the SEC that we may file from time to time, including those more fully described in our Quarterly Report on Form 10-Q for the fiscal quarter ended October 31, 2021. Additional information will be made available in our Annual Report on Form 10-K for the year ended January 31, 2022 that will be filed with the SEC, which should be read in conjunction with this press release and the financial results included herein. Any forward-looking statements contained in this press release are based on assumptions that we believe to be reasonable as of this date. Except as required by law, we assume no obligation to update these forward-looking statements, or to update the reasons if actual results differ materially from those anticipated in the forward-looking statements.
Investor Contact:
Edward Parker
ICR for Couchbase
IR@couchbase.com
Media Contact:
Michelle Lazzar
Couchbase Communications
CouchbasePR@couchbase.com
Couchbase, Inc.
Condensed Consolidated Statements of Operations
(in thousands, except per share data)
(unaudited)
|
Three Months Ended January 31, |
Year Ended January 31, |
|
2022 |
2021 |
2022 |
2021 |
| Revenue: |
| License |
$6,540 |
$5,482 |
$19,008 |
$14,032 |
| Support and other |
26,245 |
22,557 |
97,279 |
82,904 |
| Total subscription revenue |
32,785 |
28,039 |
116,287 |
96,936 |
| Services |
2,279 |
1,388 |
7,255 |
6,349 |
| Total revenue |
35,064 |
29,427 |
123,542 |
103,285 |
| Cost of revenue: |
| Subscription (1) |
2,311 |
1,961 |
8,529 |
6,074 |
| Services (1) |
1,817 |
1,160 |
6,252 |
5,543 |
| Total cost of revenue |
4,128 |
3,121 |
14,781 |
11,617 |
| Gross profit |
30,936 |
26,306 |
108,761 |
91,668 |
| Operating expenses: |
| Research and development (1) |
13,372 |
10,612 |
51,639 |
39,000 |
| Sales and marketing (1) |
23,658 |
19,103 |
89,372 |
70,248 |
| General and administrative (1) |
6,574 |
4,595 |
24,008 |
15,500 |
| Total operating expenses |
43,604 |
34,310 |
165,019 |
124,748 |
| Loss from operations |
(12,668) |
(8,004) |
(56,258) |
(33,080) |
| Interest expense |
(26) |
(2,208) |
(656) |
(6,970) |
| Other income (expense), net |
(256) |
890 |
(300) |
1,111 |
| Loss before income taxes |
(12,950) |
(9,322) |
(57,214) |
(38,939) |
| Provision for income taxes |
286 |
325 |
1,015 |
1,044 |
| Net loss |
$(13,236) |
$(9,647) |
$(58,229) |
$(39,983) |
| Cumulative dividends on Series G redeemable convertible preferred stock |
— |
(1,480) |
(2,917) |
(4,076) |
| Net loss attributable to common stockholders |
$(13,236) |
$(11,127) |
$(61,146) |
$(44,059) |
| Net loss per share attributable to common stockholders, basic and diluted |
$(0.30) |
$(1.90) |
$(2.37) |
$(7.71) |
| Weighted-average shares used in computing net loss per share attributable to common stockholders, basic and diluted |
43,688 |
5,852 |
25,777 |
5,717 |
_______________________________
Includes stock-based compensation expense as follows:
|
Three Months Ended January 31, |
Year Ended January 31, |
|
2022 |
2021 |
2022 |
2021 |
| Cost of revenue—subscription |
$73 |
$19 |
$196 |
$69 |
| Cost of revenue—services |
80 |
13 |
196 |
54 |
| Research and development |
1,119 |
348 |
3,343 |
1,316 |
| Sales and marketing |
1,447 |
523 |
3,968 |
1,536 |
| General and administrative |
868 |
426 |
3,047 |
1,696 |
| Total stock-based compensation expense |
$3,587 |
$1,329 |
$10,750 |
$4,671 |
Couchbase, Inc.
Condensed Consolidated Balance Sheets
(in thousands)
(unaudited)
|
As of January 31, |
|
2022 |
2021 |
| Assets |
| Current assets |
| Cash and cash equivalents |
$95,688 |
$37,297 |
| Short-term investments |
110,266 |
19,546 |
| Accounts receivable, net |
36,696 |
35,897 |
| Deferred commissions |
11,783 |
8,353 |
| Prepaid expenses and other current assets |
8,559 |
2,449 |
| Total current assets |
262,992 |
103,542 |
| Property and equipment, net |
4,288 |
6,506 |
| Deferred commissions, noncurrent |
8,243 |
4,941 |
| Other assets |
1,219 |
2,199 |
| Total assets |
$276,742 |
$117,188 |
| Liabilities, Redeemable Convertible Preferred Stock and Stockholders’ Equity (Deficit) |
| Current liabilities |
| Accounts payable |
$1,923 |
$2,428 |
| Accrued compensation and benefits |
16,143 |
9,110 |
| Other accrued liabilities |
3,231 |
4,154 |
| Deferred revenue |
69,010 |
57,168 |
| Total current liabilities |
90,307 |
72,860 |
| Long-term debt |
— |
24,948 |
| Deferred revenue, noncurrent |
2,713 |
4,542 |
| Other liabilities |
507 |
1,358 |
| Total liabilities |
93,527 |
103,708 |
| Redeemable convertible preferred stock |
— |
259,822 |
| Stockholders’ equity (deficit) |
| Preferred stock |
— |
— |
| Common stock |
— |
— |
| Additional paid-in capital |
525,392 |
37,410 |
| Accumulated other comprehensive income (loss) |
(195) |
1 |
| Accumulated deficit |
(341,982) |
(283,753) |
| Total stockholders’ equity (deficit) |
183,215 |
(246,342) |
| Total liabilities, redeemable convertible preferred stock and stockholders’ equity (deficit) |
$276,742 |
$117,188 |
Couchbase, Inc.
Condensed Consolidated Statements of Cash Flows
(in thousands)
(unaudited)
|
Three Months Ended January 31, |
Year Ended January 31, |
|
2022 |
2021 |
2022 |
2021 |
| Cash flows from operating activities |
| Net loss |
$(13,236) |
$(9,647) |
$(58,229) |
$(39,983) |
| Adjustments to reconcile net loss to net cash used in operating activities |
| Depreciation and amortization |
710 |
698 |
2,824 |
2,006 |
| Amortization of debt issuance costs |
— |
240 |
52 |
717 |
| Debt prepayment costs |
— |
625 |
— |
1,000 |
| Stock-based compensation |
3,587 |
1,329 |
10,750 |
4,671 |
| Amortization of deferred commissions |
3,940 |
3,316 |
13,763 |
10,402 |
| Foreign currency transaction (gains) losses |
377 |
(742) |
382 |
(931) |
| Other |
164 |
62 |
267 |
132 |
| Changes in operating assets and liabilities |
| Accounts receivable |
(14,289) |
(17,616) |
(730) |
(5,524) |
| Deferred commissions |
(8,867) |
(5,046) |
(20,495) |
(13,450) |
| Prepaid expenses and other assets |
(333) |
1,379 |
(6,217) |
56 |
| Accounts payable |
(1,604) |
282 |
(491) |
925 |
| Accrued compensation and benefits |
6,213 |
1,611 |
7,030 |
298 |
| Accrued expenses and other liabilities |
(86) |
602 |
(493) |
(279) |
| Deferred revenue |
20,772 |
16,338 |
10,013 |
782 |
| Net cash used in operating activities |
(2,652) |
(6,569) |
(41,574) |
(39,178) |
| Cash flows from investing activities |
| Purchases of short-term investments |
(46,200) |
(6,348) |
(112,479) |
(20,493) |
| Maturities and sales of short-term investments |
1,800 |
900 |
21,268 |
900 |
| Purchases of property and equipment |
(5) |
(49) |
(819) |
(2,819) |
| Net cash used in investing activities |
(44,405) |
(5,497) |
(92,030) |
(22,412) |
| Cash flows from financing activities |
| Payments of debt |
— |
(25,625) |
(25,000) |
(57,402) |
| Proceeds from issuance of debt, net of issuance costs |
— |
25,000 |
— |
31,402 |
| Proceeds from issuance of Series G redeemable convertible preferred stock, net of issuance costs |
— |
— |
— |
104,316 |
| Proceeds from exercise of stock options |
1,562 |
1,699 |
7,495 |
2,185 |
| Proceeds from initial public offering, net of underwriting discounts and commissions |
— |
— |
214,854 |
— |
| Payment for fractional shares in reverse stock split |
— |
— |
(9) |
— |
| Payments of deferred offering costs |
— |
— |
(4,930) |
— |
| Net cash provided by financing activities |
1,562 |
1,074 |
192,410 |
80,501 |
| Effect of exchange rate changes on cash, cash equivalents and restricted cash |
(257) |
168 |
(415) |
162 |
| Net increase (decrease) in cash, cash equivalents and restricted cash |
(45,752) |
(10,824) |
58,391 |
19,073 |
| Cash, cash equivalents, and restricted cash at beginning of period |
141,983 |
48,664 |
37,840 |
18,767 |
| Cash, cash equivalents, and restricted cash at end of period |
$96,231 |
$37,840 |
$96,231 |
$37,840 |
| Reconciliation of cash, cash equivalents, and restricted cash within the consolidated balance sheets to the amounts shown above: |
| Cash and cash equivalents |
$95,688 |
$37,297 |
$95,688 |
$37,297 |
| Restricted cash included in other assets |
543 |
543 |
543 |
543 |
| Total cash, cash equivalents and restricted cash |
$96,231 |
$37,840 |
$96,231 |
$37,840 |
Couchbase, Inc.
Reconciliation of GAAP to Non-GAAP Results
(in thousands, except per share data)
(unaudited)
|
Three Months Ended January 31, |
Year Ended January 31, |
|
2022 |
2021 |
2022 |
2021 |
| Reconciliation of GAAP gross profit to non-GAAP gross profit: |
| Total revenue |
$35,064 |
$29,427 |
$123,542 |
$103,285 |
| Gross profit |
$30,936 |
$26,306 |
$108,761 |
$91,668 |
| Add: Stock-based compensation expense |
153 |
32 |
392 |
123 |
| Non-GAAP gross profit |
$31,089 |
$26,338 |
$109,153 |
$91,791 |
| Gross margin |
88.2% |
89.4% |
88.0% |
88.8% |
| Non-GAAP gross margin |
88.7% |
89.5% |
88.4% |
88.9% |
|
Three Months Ended January 31, |
Year Ended January 31, |
|
2022 |
2021 |
2022 |
2021 |
| Reconciliation of GAAP operating expenses to non-GAAP operating expenses: |
| GAAP research and development |
$13,372 |
$10,612 |
$51,639 |
$39,000 |
| Less: Stock-based compensation expense |
(1,119) |
(348) |
(3,343) |
(1,316) |
| Non-GAAP research and development |
$12,253 |
$10,264 |
$48,296 |
$37,684 |
|
| GAAP sales and marketing |
$23,658 |
$19,103 |
$89,372 |
$70,248 |
| Less: Stock-based compensation expense |
(1,447) |
(523) |
(3,968) |
(1,536) |
| Non-GAAP sales and marketing |
$22,211 |
$18,580 |
$85,404 |
$68,712 |
|
| GAAP general and administrative |
$6,574 |
$4,595 |
$24,008 |
$15,500 |
| Less: Stock-based compensation expense |
(868) |
(426) |
(3,047) |
(1,696) |
| Less: Litigation-related expenses |
— |
— |
— |
(213) |
| Non-GAAP general and administrative |
$5,706 |
$4,169 |
$20,961 |
$13,591 |
|
Three Months Ended January 31, |
Year Ended January 31, |
|
2022 |
2021 |
2022 |
2021 |
| Reconciliation of GAAP operating loss to non-GAAP operating loss: |
| Total revenue |
$35,064 |
$29,427 |
$123,542 |
$103,285 |
| Loss from operations |
$(12,668) |
$(8,004) |
$(56,258) |
$(33,080) |
| Add: Stock-based compensation expense |
3,587 |
1,329 |
10,750 |
4,671 |
| Add: Litigation-related expenses |
— |
— |
— |
213 |
| Non-GAAP operating loss |
$(9,081) |
$(6,675) |
$(45,508) |
$(28,196) |
| Operating margin |
(36)% |
(27)% |
(46)% |
(32)% |
| Non-GAAP operating margin |
(26)% |
(23)% |
(37)% |
(27)% |
|
Three Months Ended January 31, |
Year Ended January 31, |
|
2022 |
2021 |
2022 |
2021 |
| Reconciliation of GAAP net loss attributable to common stockholders to non-GAAP net loss attributable to common stockholders: |
| Net loss attributable to common stockholders |
$(13,236) |
$(11,127) |
$(61,146) |
$(44,059) |
| Add: Stock-based compensation expense |
3,587 |
1,329 |
10,750 |
4,671 |
| Add: Litigation-related expenses |
— |
— |
— |
213 |
| Non-GAAP net loss attributable to common stockholders |
$(9,649) |
$(9,798) |
$(50,396) |
$(39,175) |
| GAAP net loss per share attributable to common stockholders |
$(0.30) |
$(1.90) |
$(2.37) |
$(7.71) |
| Non-GAAP net loss per share attributable to common stockholders |
$(0.22) |
$(1.67) |
$(1.96) |
$(6.85) |
| Weighted average shares outstanding, basic and diluted |
43,688 |
5,852 |
25,777 |
5,717 |
The following table presents a reconciliation of free cash flow to net cash used in operating activities, the most directly comparable GAAP measure, for each of the periods indicated (in thousands, unaudited):
|
Three Months Ended January 31, |
Year Ended January 31, |
|
2022 |
2021 |
2022 |
2021 |
| Net cash used in operating activities |
$(2,652) |
$(6,569) |
$(41,574) |
$(39,178) |
| Less: Purchases of property and equipment |
(5) |
(49) |
(819) |
(2,819) |
| Free cash flow |
$(2,657) |
$(6,618) |
$(42,393) |
$(41,997) |
| Net cash used in investing activities |
$(44,405) |
$(5,497) |
$(92,030) |
$(22,412) |
| Net cash provided by financing activities |
$1,562 |
$1,074 |
$192,410 |
$80,501 |
Couchbase, Inc.
Key Business Metrics
(in millions)
(unaudited)
|
As of |
|
Oct. 31, |
Jan. 31, |
April 30, |
July 31, |
Oct. 31, |
Jan. 31, |
|
2020 |
2021 |
2021 |
2021 |
2021 |
2022 |
| Annual Recurring Revenue |
$101.4 |
$107.8 |
$109.5 |
$115.2 |
$122.3 |
$132.9 |
Santa Clara, Calif. – March 1, 2022 – Couchbase, Inc. (NASDAQ: BASE), provider of a leading modern database for enterprise applications, today announced Gopi Duddi as senior vice president of Engineering where he will oversee all product development and delivery for the company. Duddi is an established leader with nearly 25 years of experience in database software and cloud solution design, development and operations, having built and supported some of the most scaled services and applications in all of enterprise technology.
“Gopi’s deep experience delivering industry-leading cloud products with velocity and scaling highly innovative and disruptive product organizations is an outstanding fit as we continue to invest in our industry-leading modern database for enterprise applications by enhancing the developer experience and building out our database as a service, Couchbase Capella,” said Matt Cain, president and chief executive officer of Couchbase. “He has been at the forefront of cloud database development for the last decade and has a proven track record of leading teams to build and ship high-growth software products that enable digital transformation for customers. We are thrilled to welcome Gopi to the world-class Couchbase executive team.”
Duddi has significant cloud expertise, including in core database technologies, data management, machine learning and full-stack development. He was most recently general manager for AWS Analytics and Observability, where he scaled and accelerated engineering for AWS services including AWS Glue and AWS CloudWatch which were among the cloud service provider’s fastest growing products. He previously worked on the AWS Redshift team and a broad cross-section of database and analytics services including DynamoDB and Amazon Relational Database Service (Amazon RDS). Prior to AWS, Duddi held senior database engineering roles at IBM and Informix.
“Having been at a major cloud service provider for the past nine years, I have seen first hand how the market for cloud databases has accelerated and is seeing strong demand from customers as they seek greater developer agility and fewer infrastructure management responsibilities,” said Duddi. “Couchbase has a differentiated architecture that has been purpose built for the most demanding enterprise applications that need to seamlessly run from cloud to the edge, and I could not be more excited to join the team. I am passionate about helping customers solve difficult problems and look forward to applying this expertise at Couchbase.”
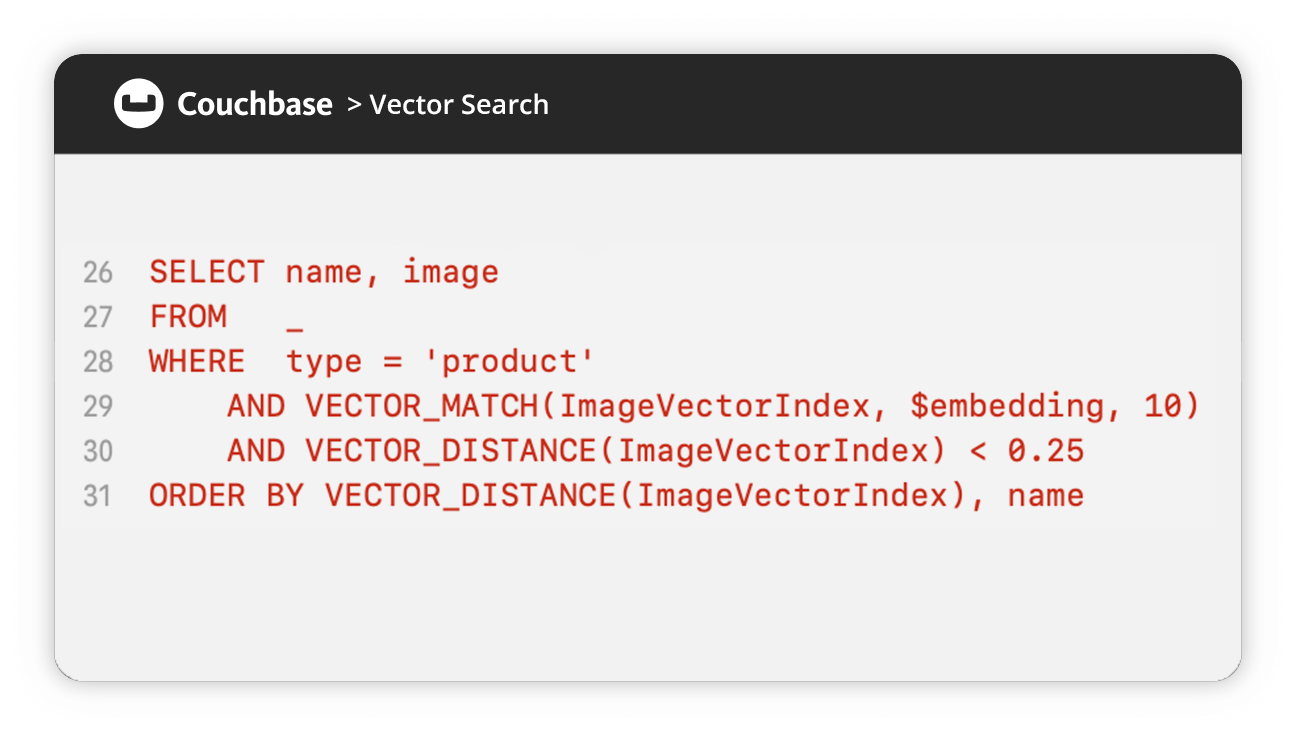
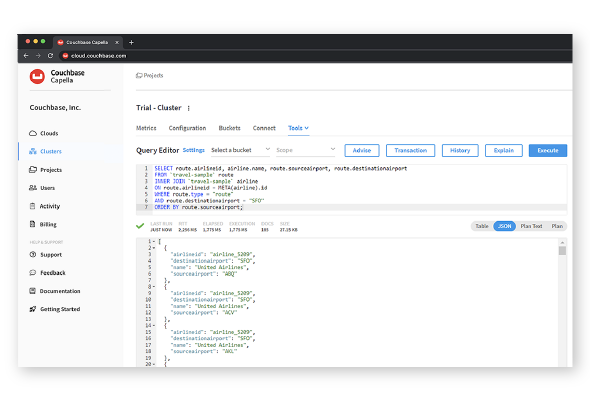
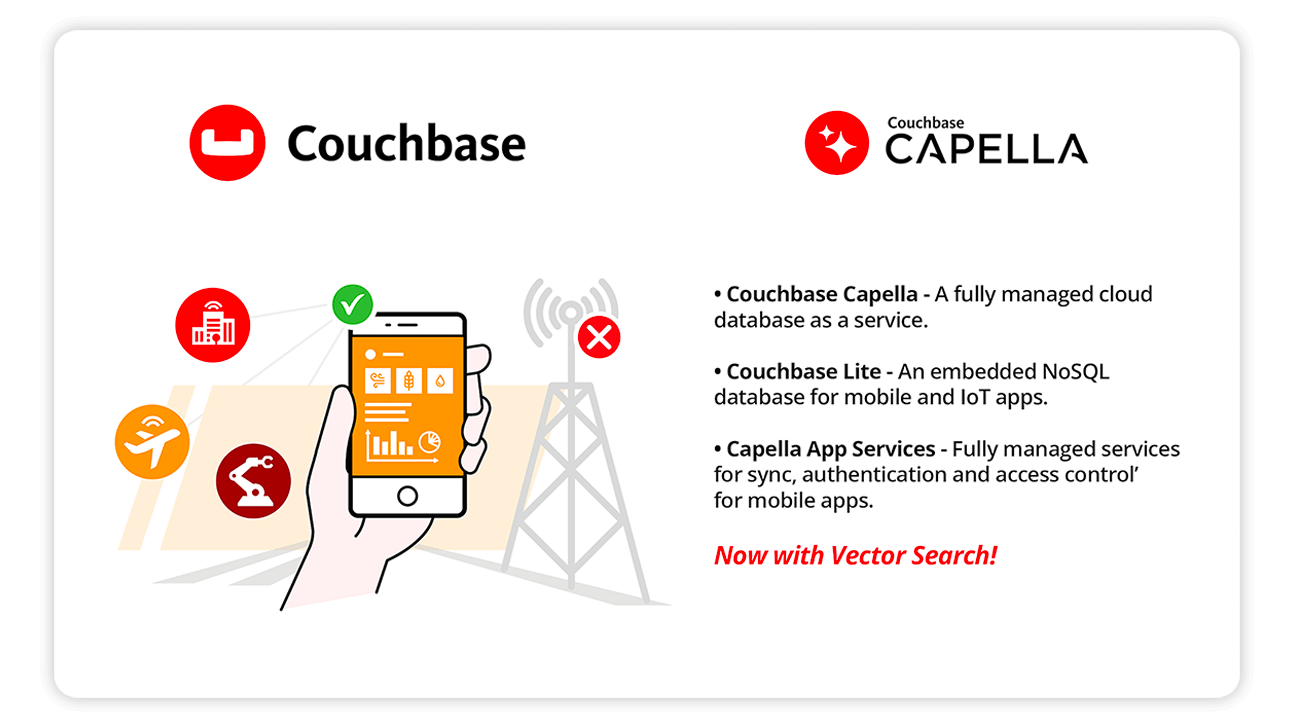

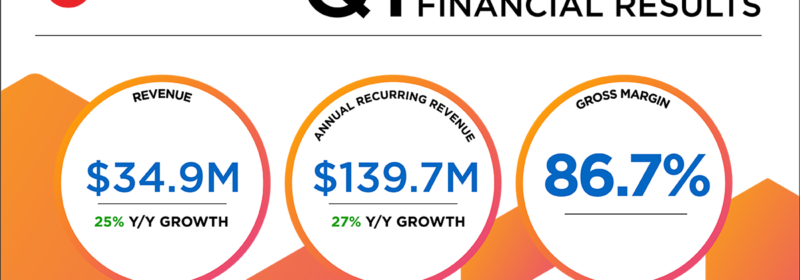