It’s a common experience to run into network connection errors when you’re developing an application – particularly if you’re connecting from your local computer SDK to a remote cluster.
Is your SDK not connected? You’re likely to run into situations where your application can connect to the server but you get errors related to the network connection or IP addresses between the nodes or your app and the Couchbase SDK.
This article discusses how you can troubleshoot and fix these errors. The example we’ll walkthrough below creates a cluster in Azure to demonstrate the initial conditions, but it should be applicable to other installations as well.
We’ll go through each step in order to replicate the error. First, we’ll install Couchbase in Azure, then run SDK Doctor to see how the error manifests itself, then update the alternate addresses, and finally run the SDK Doctor again to see the successful response.
Okay, let’s dive in.
Install Your Couchbase Cluster in Azure
Here are your steps for installing a Couchbase cluster in Azure.
- Log into the Microsoft Azure Marketplace
- Search for Couchbase
- Choose Couchbase Server and Sync Gateway
- Click Get It Now
- Choose BYOL
- Click Continue
- Click Create
- Fill out form
- Admin:
asdf88495< Update this as appropriate - Password:
Password1!@#$< Update this as appropriate - Complete configuration forms as appropriate
- Click Create
The process runs and looks like so once you’ve completed all the steps:

Update Firewall Rules
You likely need to update firewall rules to allow your local computer to connect to the remote Azure cluster. Here are the steps:
1. Go to Resource Group
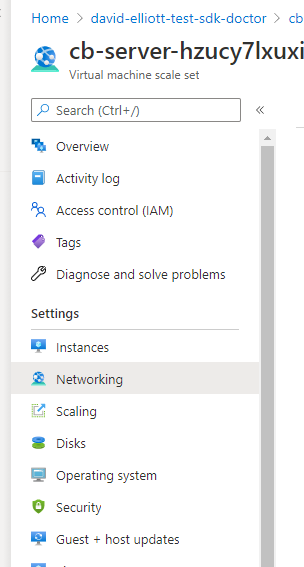
2. Click on Virtual machine scale set
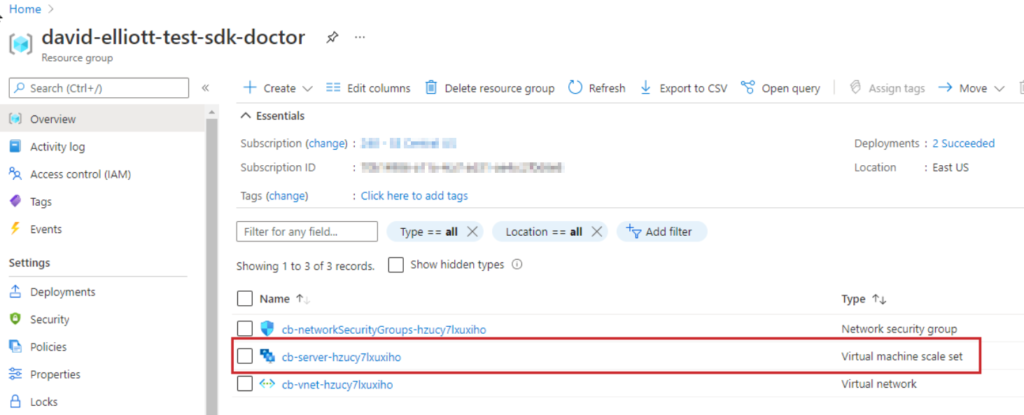
3. Click on Networking
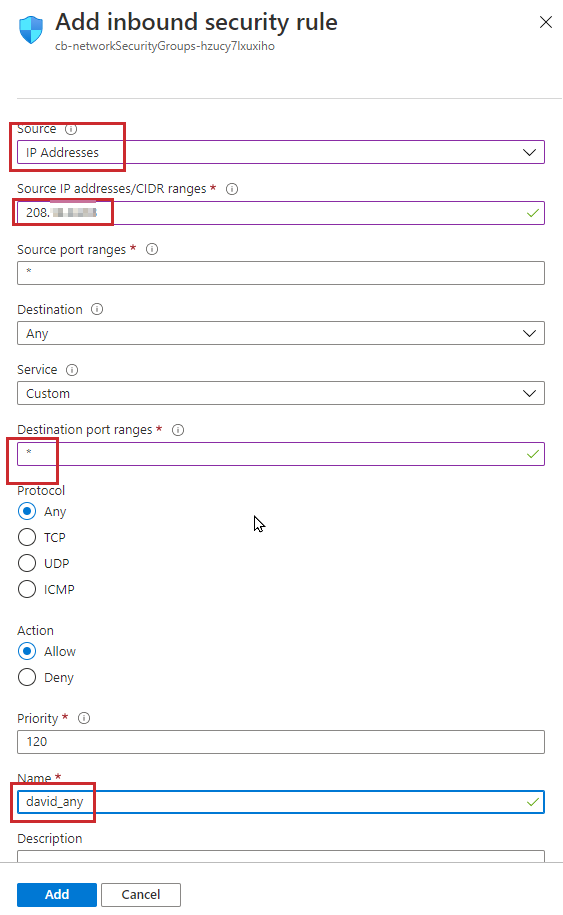
4. Click Add inbound port rule

5. Update the configuration to use your local network information. Warning: This is very open for the purposes of this demonstration, you should follow your security guidelines when configuring the firewall.
Confirm Couchbase Is Up and Running
Your next major step is to confirm that Couchbase is up and running. Here’s how you do that:
1. Go to instances to get an IP address and connect to the Couchbase control panel.
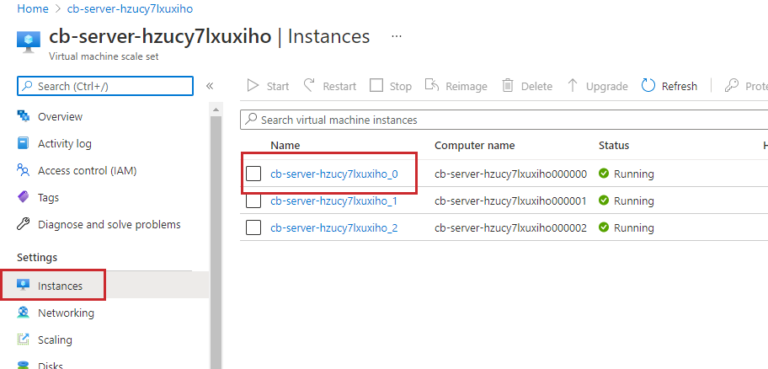
2. Get the IP address for one of your servers.
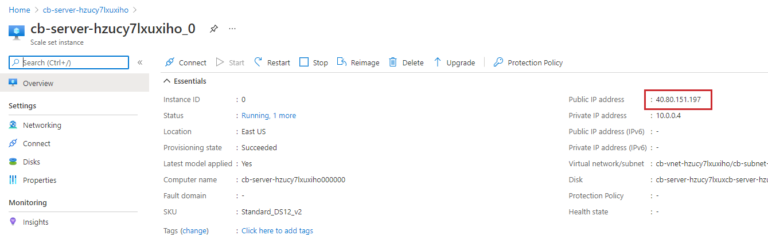
3. In this example, the login is https://40.80.151.197:8091/ui/index.html.
4. Login with the info used to create the admin account from the “Install Your Couchbase Cluster in Azure” section above. This was where you created the cluster in Azure and completed the form.
5. In Couchbase, add sample data to use for this demonstration. Follow the instructions in the Couchbase documentation for adding data from sample buckets.
Introducing the SDK Doctor
The Couchbase SDK doctor is a tool to diagnose application-server-side connectivity issues with your Couchbase cluster. It makes the same connections to the Couchbase Server cluster that Couchbase SDKs make during bootstrapping, and then reports on the state of the connections made – giving diagnostic information that helps you solve puzzling network issues.
Here is the full set of the instructions for using the SDK Doctor with Couchbase Server.
1. Running the SDK Doctor to Spot Errors
Following the instructions above – where you collected the IP address for your Couchbase cluster – get the IP addresses for each of the other nodes in your cluster as well. You’ll use the IP addresses in the connection string for the SDK Doctor.
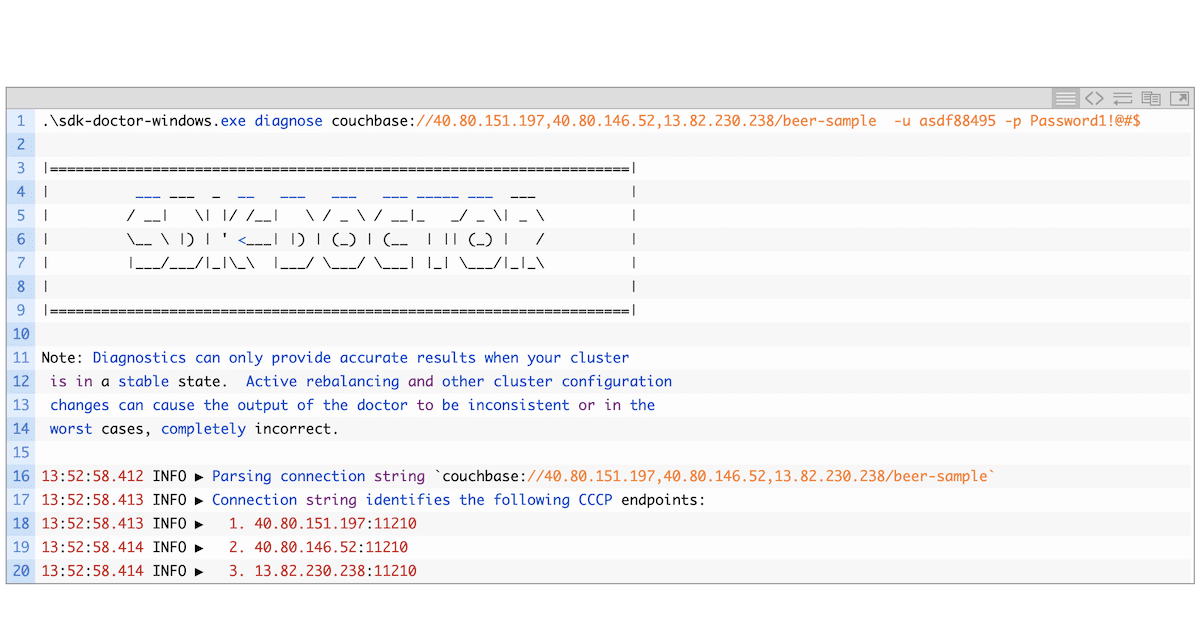
The command below uses the IP addresses for the nodes in your cluster in addition to the sample data bucket name. You will need to update this information based on your own cluster IPs and the specific sample bucket you installed.
Now, run the SDK Doctor.
You’ll probably get a bunch of error messages – as you can see below – especially if you are running SDK Doctor from a local computer and not on the same network as the nodes/cluster/VMs. You’ll see the ERROR and Failed to connect messages. Notice the IP addresses are the internal 10 addresses, not the 40 or 13.
You may need to double-click the code sample below to see the full output (depending on your device).
|
1 |
Using the Couchbase Alternate Address
Couchbase Server allows an alternate address to be assigned to any individual cluster-node, and an alternate port number to be assigned to any service running on that node.
The assigning of alternate addresses and port numbers – which can be accomplished by means of the CLI and the REST API – may facilitate communication with external applications that are not permitted to contact a cluster’s nodes directly. However, they may have access to a router or other networked entity that provides externally visible addresses on the nodes’ behalf.
Dive into the Couchbase documentation on using alternate addresses to learn more.
Add the Couchbase Alternate Address
There is a REST call to update the alternate address for your Couchbase cluster. (For more information, check out the Couchbase documentation on managing alternate addresses with the REST API.)
Next, you’ll want to update the alternate address for each IP address in the cluster. This maps the internal to the IP address that you specify.
|
1 |
curl –v –X PUT –u asdf88495:Password1!@#$ https://40.80.151.197:8091/node/controller/setupAlternateAddresses/external -d hostname=40.80.151.197 |
You should get a 200 response, as you can see below.
|
1 2 3 4 5 6 7 8 9 10 11 12 13 14 15 16 17 18 19 20 21 22 23 24 |
* Trying 13.82.230.238… * TCP_NODELAY set * Connected to 13.82.230.238 (13.82.230.238) port 8091 (#0) * Server auth using Basic with user ‘asdf88495’ > PUT /node/controller/setupAlternateAddresses/external HTTP/1.1 > Host: 13.82.230.238:8091 > Authorization: Basic YXNkZjg4NDk1OlBhc3N3b3JkMSFAIyQ= > User–Agent: curl/7.55.1 > Accept: */* > Content–Length: 22 > Content–Type: application/x–www–form–urlencoded > * upload completely sent off: 22 out of 22 bytes < HTTP/1.1 200 OK < X–XSS–Protection: 1; mode=block < X–Permitted–Cross–Domain–Policies: none < X–Frame–Options: DENY < X–Content–Type–Options: nosniff < Server: Couchbase Server < Pragma: no–cache < Expires: Thu, 01 Jan 1970 00:00:00 GMT < Date: Mon, 28 Jun 2021 18:59:31 GMT < Content–Length: 0 < Cache–Control: no–cache,no–store,must–revalidate |
Repeat the command for the other hosts as well, like so:
|
1 |
curl –v –X PUT –u asdf88495:Password1!@#$ https://40.80.146.52:8091/node/controller/setupAlternateAddresses/external -d hostname=40.80.146.52 |
|
1 |
curl –v –X PUT –u asdf88495:Password1!@#$ https://13.82.230.238:8091/node/controller/setupAlternateAddresses/external -d hostname=13.82.230.238 |
2. Running the SDK Doctor to Confirm Success
Now, run the SDK Doctor again to confirm success. You should get something like this below:
You may need to double-click the code sample below to see the full output (depending on your device).
|
1 |
Success!
Conclusion
Connecting to Couchbase clusters in the cloud offers a lot of advantages. But sometimes – due to various network and security requirements – the remote and distributed nature of systems can cause complications between your app SDK and the Couchbase cluster.
By using the Couchbase SDK Doctor and Alternate Addresses, you can easily troubleshoot any complications that arise and fix connection problems right away.
Ready to try out Couchbase Server for yourself?<br/ >Take Couchbase 7 for a spin
댓글 남기기
댓글을 달기 위해서는 로그인해야합니다.