
Servicios de la aplicación Capella es un backend como servicio (BaaS) totalmente administrado, diseñado específicamente para aplicaciones móviles, de IoT y perimetrales. Permite a los desarrolladores y organizaciones integrarse sin problemas con Couchbase Capella y sincronizar datos entre varias aplicaciones perimetrales utilizando Couchbase Lite.
Aunque Capella App Services es un entorno administrado, el monitoreo proporciona información valiosa y control. Le permite rastrear métricas clave sobre la utilización de recursos, el rendimiento, las tasas de errores y muchas más, ayudando así a la identificación de cuellos de botella en el rendimiento y problemas de escalabilidad.
Además, la detección proactiva de problemas mediante alertas minimiza el tiempo de inactividad de las aplicaciones de extremo a extremo y garantiza una operación continua. La planificación de la capacidad también se vuelve más efectiva con el monitoreo, ya que analiza los patrones de uso de recursos y toma decisiones informadas sobre el escalado de la infraestructura y la optimización de costos.
En esta publicación de blog, exploraremos cómo puede monitorear fácilmente los Servicios de Aplicaciones de Capella usando Prometeo métricas y Grafana. Te guiaremos a través del proceso de configuración de Prometheus para recopilar y almacenar métricas de Capella App Services. Además, demostraremos cómo aprovechar Grafana para crear paneles atractivos que proporcionen información en tiempo real sobre el rendimiento y el comportamiento de tus aplicaciones.
Prerrequisitos
Antes de sumergirte en el tutorial, asegúrate de cumplir con los siguientes requisitos previos:
- Un Capella desplegado App Service y configurado Punto de extremo de la aplicación.
- Docker instalado en tu máquina local.
Antecedentes
Métricas de la interfaz web de Capella App Services
Capella App Services ofrece capacidades de monitoreo listas para usar a través de su interfaz de usuario web, consulte el Documentación de los endpoints de la aplicación de monitoreo. La pestaña Monitoreo dentro de la interfaz de usuario web ofrece una interfaz intuitiva para graficar diversas métricas relacionadas con el volumen y el rendimiento de los documentos que se sincronizan a través de App Services y para un punto de conexión de aplicación determinado. Estas métricas incluyen:
- Nivel de nodo de App Services:
- Bytes enviados y recibidos por el nodo
- Utilización de CPU y memoria
- Nivel de extremo de aplicación:
- Total de fallos y éxitos de autenticación
- Sincronizaciones delta solicitadas y enviadas
- Total de documentos importados, leídos, escritos y rechazados
- Número de activos replicaciones de solo extracción
API de métricas de Capella App Services
Si bien la interfaz web ofrece un conjunto completo de métricas, es posible que necesite información más detallada y personalizable para satisfacer sus necesidades específicas de monitoreo. En tales casos, se puede utilizar la API de Métricas de App Services. Esta API proporciona datos en formato Prometheus, lo que le permite recuperar una amplia gama de métricas mediante programación.
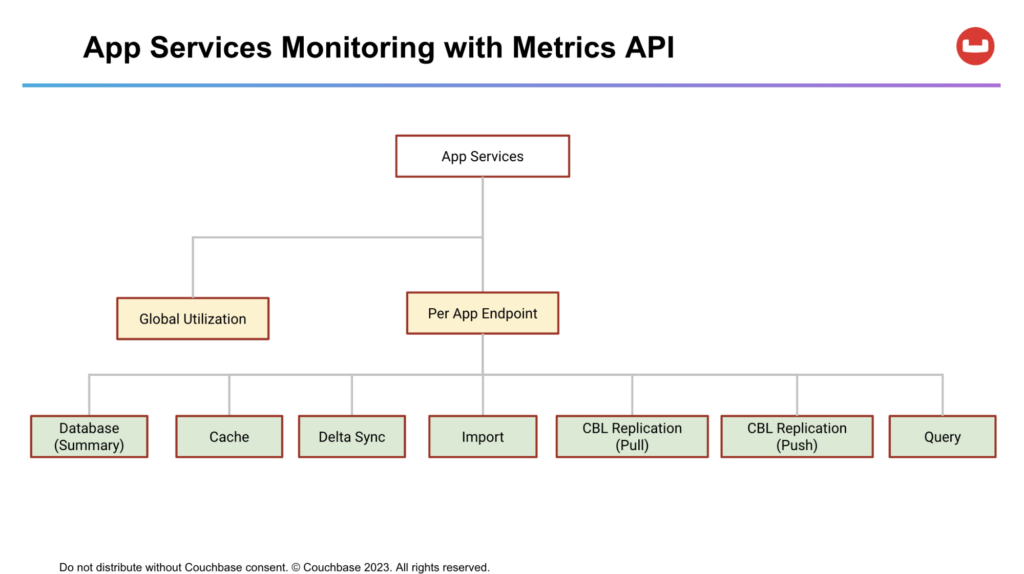
El API de métricas de App Services ofrece una forma de acceder a métricas en tiempo real relacionadas con Capella App Services. Proporciona un conjunto completo de métricas a diferentes niveles para monitorear y analizar el rendimiento del sistema.
Estas métricas incluyen estadísticas de uso del clúster global, las cuales brindan información sobre el consumo general de recursos de un nodo de App Services. Una instancia de App Service consta de varios nodos.
Para cada nodo, la API también ofrece métricas por punto de acceso de la aplicación, lo que permite a los usuarios examinar las características de rendimiento específicas y los patrones de utilización de los puntos de acceso individuales dentro de un nodo. Estas métricas incluyen la utilización de caché, sincronización delta, importación, replicación de Couchbase Lite (envío y recepción) y métricas relacionadas con consultas.
Prometeo
Prometeo es una plataforma de monitoreo y alertas de sistemas de código abierto alojada en Cloud Native Computing Foundation. En el centro de todo está el Servidor de Prometheus el cual se encarga de consultar los “destinos de Prometheus” para obtener métricas y almacenarlas como datos de series temporales. Los destinos de Prometheus se configuran de forma estática o pueden ser descubiertos por Prometheus.
Grafana
Grafana es una plataforma de visualización de datos y alertas de código abierto. Es compatible con Prometheus como fuente de datos y se puede utilizar para crear paneles completos.
Arquitectura de implementación
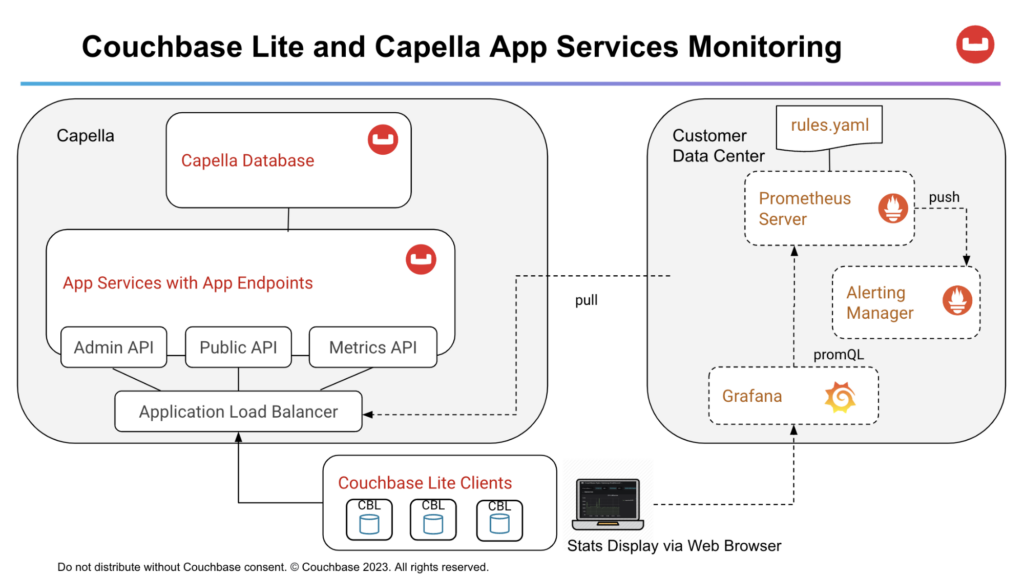
- Servidor de Prometheus consulta continuamente la API de métricas que devuelve métricas en formato Prometheus. El servidor utiliza las reglas definidas en el rules.yaml para enviar alertas a Administrador de alertas.
- Grafana el servicio consulta al servidor de Prometheus para obtener métricas y las grafica en un panel basado en la web al que se puede acceder mediante el navegador web.
Configurar los servicios de aplicaciones de Capella para el acceso a métricas
Antes de continuar con este paso, es importante asegurarse de que tiene Capella App Services configurado y en ejecución. Si aún no lo ha hecho, puede seguir los detallados tutorials provided by Capella to set up a sample database, import relevant data, and create an App endpoint. This will ensure that you have the necessary foundation in place to effectively follow along with this tutorial.
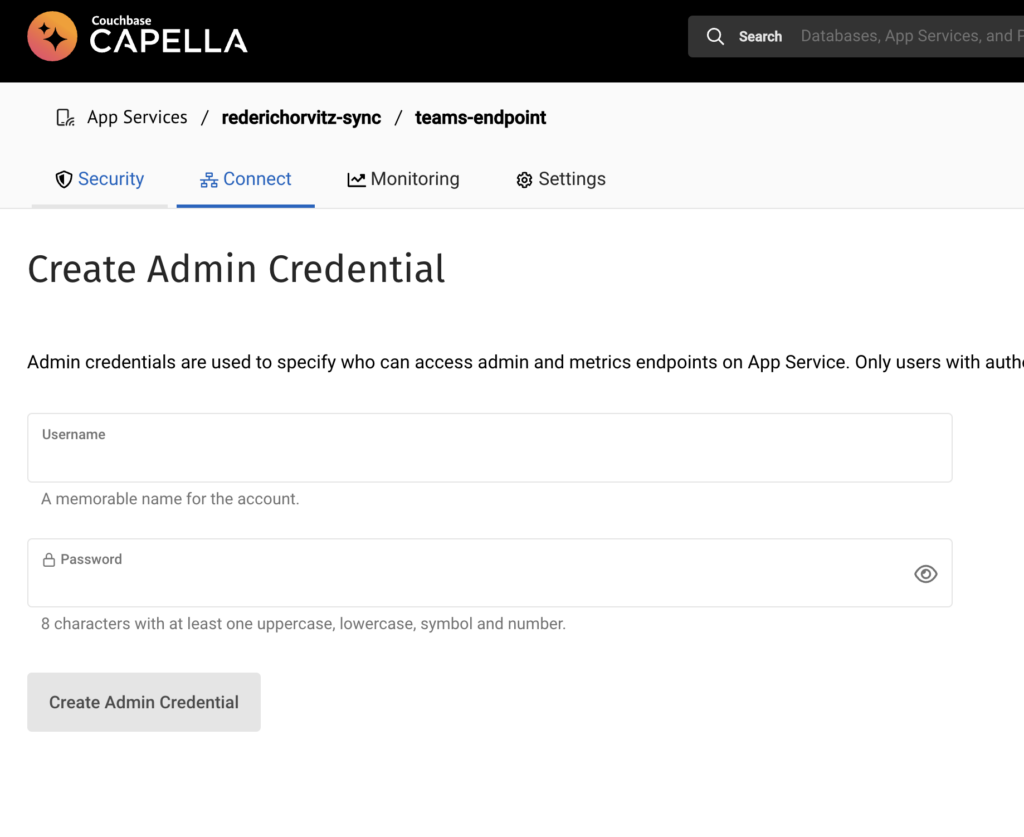
Firstly, go to the Conectar screen of an App Endpoint:
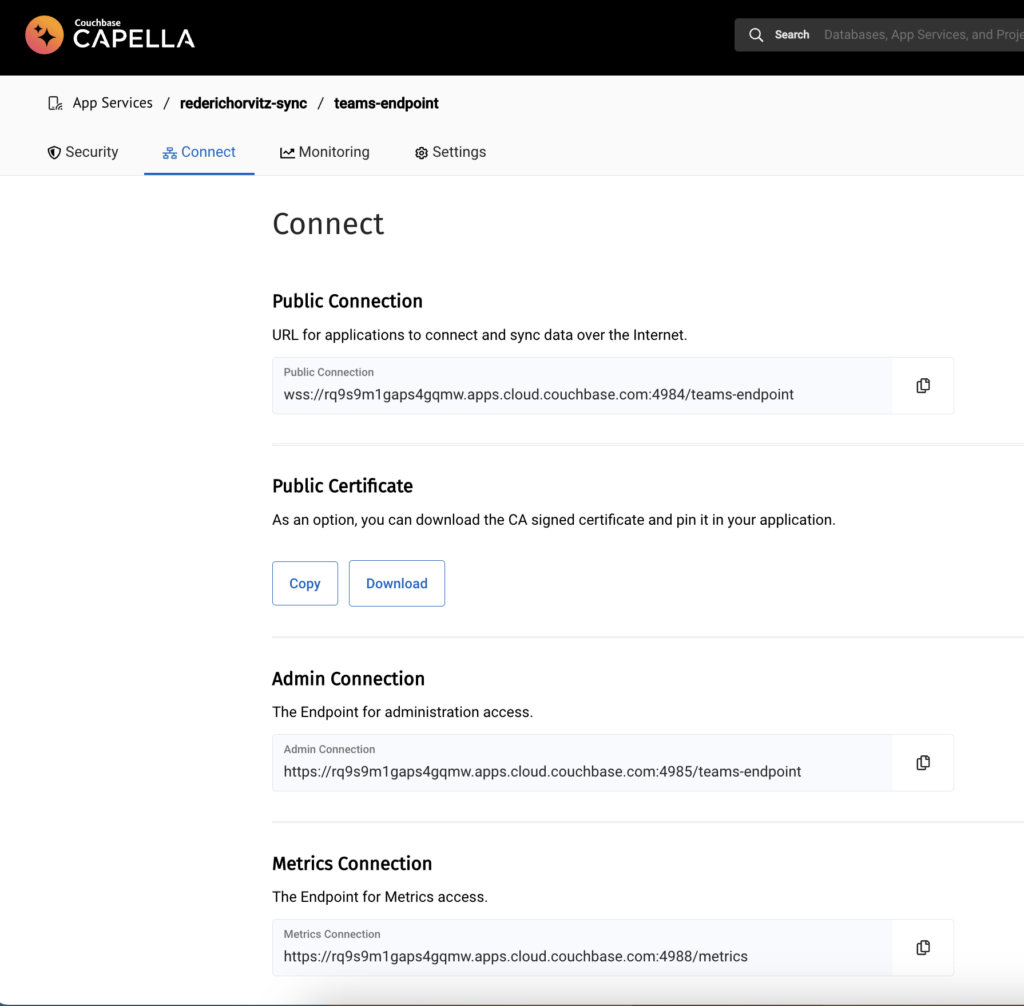
Setting up Admin Credentials: Set up admin credentials for your App endpoint. This ensures that only authenticated users with admin privileges can access the admin and metrics endpoints. Implementing authentication is highly recommended as it enhances the security of data access through the Metrics API.
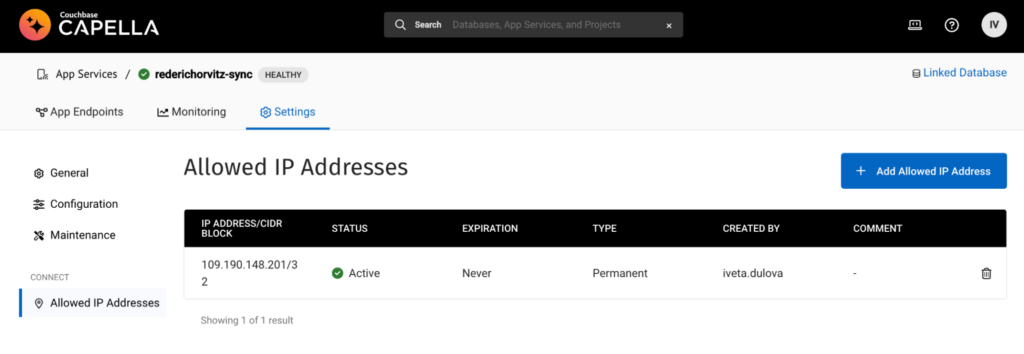
Configure Allowed IP Addresses: To allow the host to pull metrics from the Capella App Services Metrics API, you need to add its IP address to the “Allow IP Addresses” configuration. Make sure to provide the IP address in CIDR format. This step ensures that the designated host is permitted to access and retrieve metrics from the API.
Validate Metrics URL Access: Try out the Metrics API endpoint locally using cURL to verify you have access to the metrics with the supplied username and password, e.g. curl -u username:password metricsEndpointUrl.
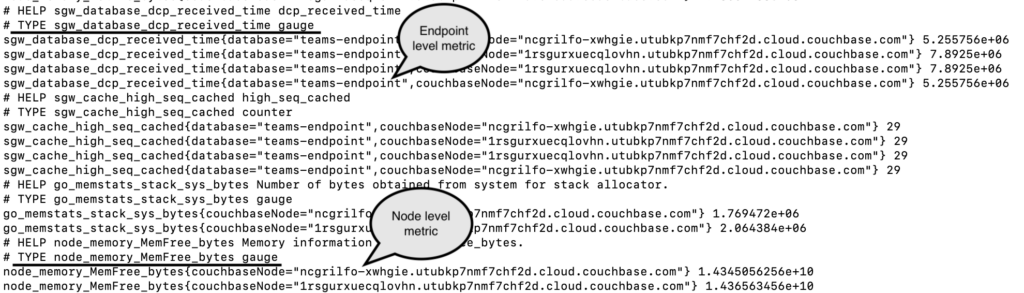
In the output above, we can observe per endpoint metrics that offer insights into specific App Services endpoints. One such metric, sgw_database_dcp_received_time, measures the time it takes for a document to be received by Sync Gateway over DCP after a write operation. These per endpoint metrics are prefixed with sgw_database and have separate entries for each of the App Services nodes and endpoints.
Additionally, the Prometheus format Metrics API provides per node metrics that allow monitoring of global node utilization. These metrics encompass various aspects such as memory usage, CPU utilization, and heap and stack statistics. Prefixed with nodo, these metrics offer information specific to individual nodes. For instance, a metric like free memory bytes indicates the amount of available memory on a particular node.
Above can be seen examples of per endpoint metrics, such as sgw_database_dcp_received_time, which indicates the time between a document write and that document being received by Sync Gateway over DCP. Per endpoint metrics are prefixed with sgw_database and have separate entries for each of the App Services nodes. There are also per node metrics such as global node utilization metrics, e.g. memory, CPU, heap and stack related stats. These are prefixed with nodo, such as the free memory bytes example in the screenshot.
Consumers can aggregate and transform these metrics to be per App Endpoint depending on their use case.
Setting up Monitoring Framework
In a real world scenario, a monitoring framework would typically be set up in your data center or in the cloud. However, for this discussion, we’ll be using a local dev machine. This serves as a controlled environment to understand the setup before implementing it on a larger scale. For a practical guide, see Amazon CloudWatch’s Prometheus integration for EC2: CloudWatch Agent PrometheusEC2.
Creating a Docker network
When using Docker, it is recommended to run all the components on the same Docker network. Create a Docker network named monitoreo: docker network create monitoring
Setting up Prometheus
- Pull the latest Prometheus Docker image: docker pull prom/prometheus
- Create a local prometheus.yml configuration file and modify it to contain the following:
|
1 2 3 4 5 6 7 8 9 10 11 12 |
global: scrape_interval: 5s evaluation_interval: 5s scrape_configs: job_name: aplicación–services metrics_path: /métricas scheme: https basic_auth: nombre de usuario: {{admin_username}} contraseña: {{admin_password}} static_configs: – targets: [‘{{target_app_services_metrics_url}}’] |
Replace the placeholders {{admin_username}} y {{admin_password}} with the admin credentials you created in the Configure Capella App Services Metrics API section.
El {{target_app_services_metrics_url}} refers to the Metrics endpoint URL, which can be found under the Conectar tab of your App endpoint. When adding this URL to the Prometheus configuration targets array, make sure to remove the protocol (https://) as it is already specified in the scheme: https field. In addition, remove /metrics from the URL as it is specified under metrics_path.
Optional: If you wish to use the Prometheus App Services metrics to define alerts for events such as auth failures, document access, you can create a local rules.yml configuration file inside a /rules directory and use some of our examples as a starting point, but you can customize the file and add more alerts based on the App Services metrics from the Metrics API.
In addition, you should include rule_files in your prometheus.yml configuration, see example below. The path /etc/prometheus/rules/* indicates the location of the rule files within the Prometheus container and it is relative to the container’s file system.
|
1 2 3 4 5 6 7 8 9 10 11 12 13 14 15 16 17 18 19 20 21 22 23 24 25 26 27 28 29 30 31 32 33 34 35 36 |
rule_files: – ‘/etc/prometheus/rules/*’ groups: – nombre: aplicación–service.rules rules: – record: sgw::gsi::total_queries expr: sum by (instance, base de datos, job) ({__name__=~“sgw_gsi_views_.*_count”}) – alert: TooManyDocumentAccessFailuresInLastHour expr: deriv(sgw_security_num_access_errors[1h]) El resultado de tu pregunta se muestra a continuación: 1000 para: 1m labels: severity: warning annotations: summary: Too many Documento Access Failures en Last Hour – alert: TooManyDocumentRejectionFailuresInLastHour expr: deriv(sgw_security_num_docs_rejected[1h]) El resultado de tu pregunta se muestra a continuación: 1000 para: 1m labels: severity: warning annotations: summary: Too many Documento Rejection Failures en Last Hour – alert: GlobalErrorCount expr: increase(sgw_resource_utilization_error_count[1h]) El resultado de tu pregunta se muestra a continuación: 1 para: 1m labels: severity: warning annotations: summary: Un error occurred en el last hour – alert: WarnXattrSizeCount expr: increase(sgw_database_warn_xattr_size_count[1h]) El resultado de tu pregunta se muestra a continuación: 0 para: 1m labels: severity: warning annotations: summary: A documento had larger sync datos than el maximum allowed by xattrs en el last hour |
These rules will serve as triggers for Prometheus alerts. For detailed guidance on writing alerts in Prometheus, refer to the Prometheus Alerting rules documentation.
Start the Docker Prometheus container using the following command. Modify to suit your context:
|
1 |
Docker run –p 9090:9090 —nombre prometheus –d –v `pwd`/prometheus.yml:/etc/prometheus/prometheus.yml —network=monitoreo prom/prometheus |
- –name prometheus: This parameter sets a custom name for the container. In this case, the container is named prometheus. You can refer to this name when interacting with the container later on.
- -d: This parameter runs the container in detached mode, meaning it runs in the background and doesn’t attach to the terminal.
- -v
pwd/prometheus.yml:/etc/prometheus/prometheus.yml: This parameter specifies a volume mount, allowing you to map a file or directory on the host machine to a location inside the container. This allows you to provide a custom configuration file for Prometheus. - (Optional) -v pwd/rules:/etc/prometheus/rules: This parameter specifies another volume mount, mapping the rules directory from the rules directory on the host machine to the /etc/prometheus/rules path inside the container. This allows you to provide custom rule files for Prometheus.
- –network monitoring: Specifying that Prometheus should be connected to the “monitoring” network.
- prom/prometheus: This is the name of the Docker image that will be used to create the container. In this case, it uses the prom/prometheus image from Docker Hub.
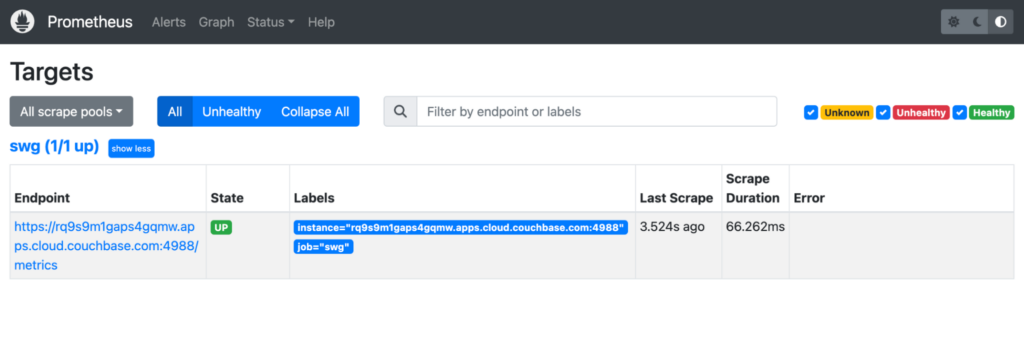
You should now be able to open the Prometheus Dashboard in https://localhost:9090 and verify that the target is responding with State=UP. Prometheus targets are the endpoints or services that Prometheus scrapes for metrics. When a target is labeled as state: up in Prometheus, it means that Prometheus successfully reached and scraped the target, and it is considered healthy and available.
Visualizing Metrics
Using Prometheus Web UI
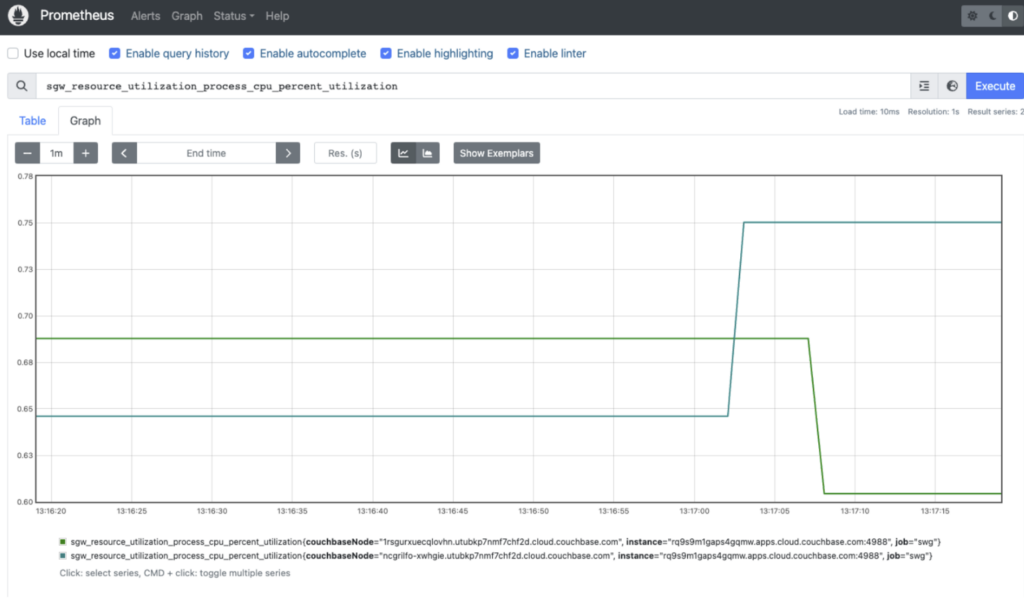
Now, you can visualize the data from the Metrics API of your App endpoint using the Prometheus Web UI on localhost. The Metrics API provides a wide range of available metrics that can be explored using the Prometheus Metrics Explorer. You can click on the Graph tab and then select one of the attributes from the drop-down, e.g. sgw_resource_utilization_process_cpu_percent_utilization and click Execute.
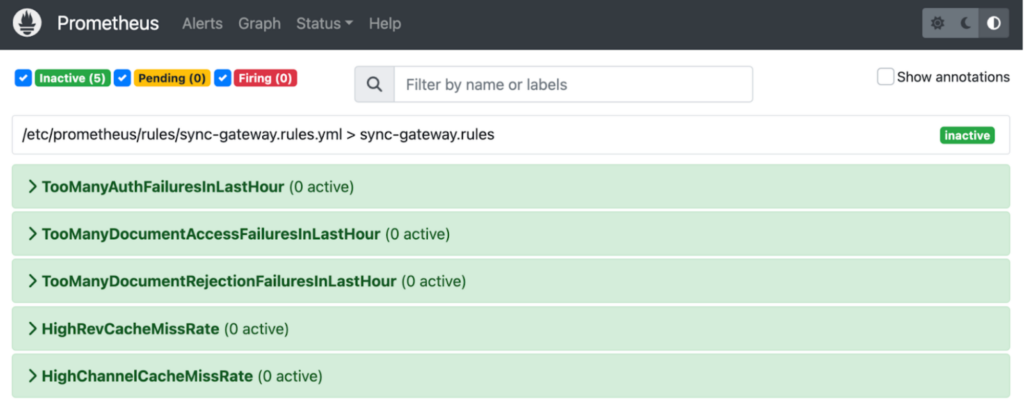
Optional: If you have opted in for creating a rules.yml file with alerting rules, the custom alert rules are included in the Docker image and mounted at /rules:/etc/prometheus/rules. As a result, these alerts can now be easily observed on the Prometheus Web UI.
Using Grafana
Instead of using Prometheus’s web interface to visualize the statistics, we will utilize Grafana since it provides the ability to create captivating dashboards and seamlessly integrates with Prometheus. To start Grafana and consume metrics from your containerized Prometheus server, you can follow these steps:
Pull latest Grafana Docker image:
|
1 |
Docker pull grafana/grafana |
Start the Grafana Prometheus container using the following command and modify to suit your context:
|
1 |
Docker run –d –p 3000:3000 —nombre grafana —network monitoreo grafana/grafana |
By default, when the Grafana container is killed or stopped, the data stored within the container will be lost. You can use a database to persist the dashboards and other essential metadata. For more information, refer to the Grafana documentation.
Open the URL https://localhost:3000 in a web browser. You should see the Log In screen. Log in with the default credentials of admin and password of admin. You can change it after the initial login.
Add Prometheus as a data source: In the Grafana UI, go to the Configuration section and select Data Sources. Click on Add Data Source and choose Prometeo as the data source type. Configure Prometheus data source: Provide the necessary details to configure the Prometheus data source.
Set the URL to https://{{containerIPAddress}}:9090 (assuming your containerized Prometheus server is running on port 9090), where {{containerIPAddress}} can be obtained by the following command:
|
1 |
Docker inspect –f ‘{{range .NetworkSettings.Networks}}{{.IPAddress}}{{end}}’ <container_id_or_nameEl resultado de tu pregunta se muestra a continuación: |
Configure any other settings as required and click Save and Test to verify the connection to Prometheus.
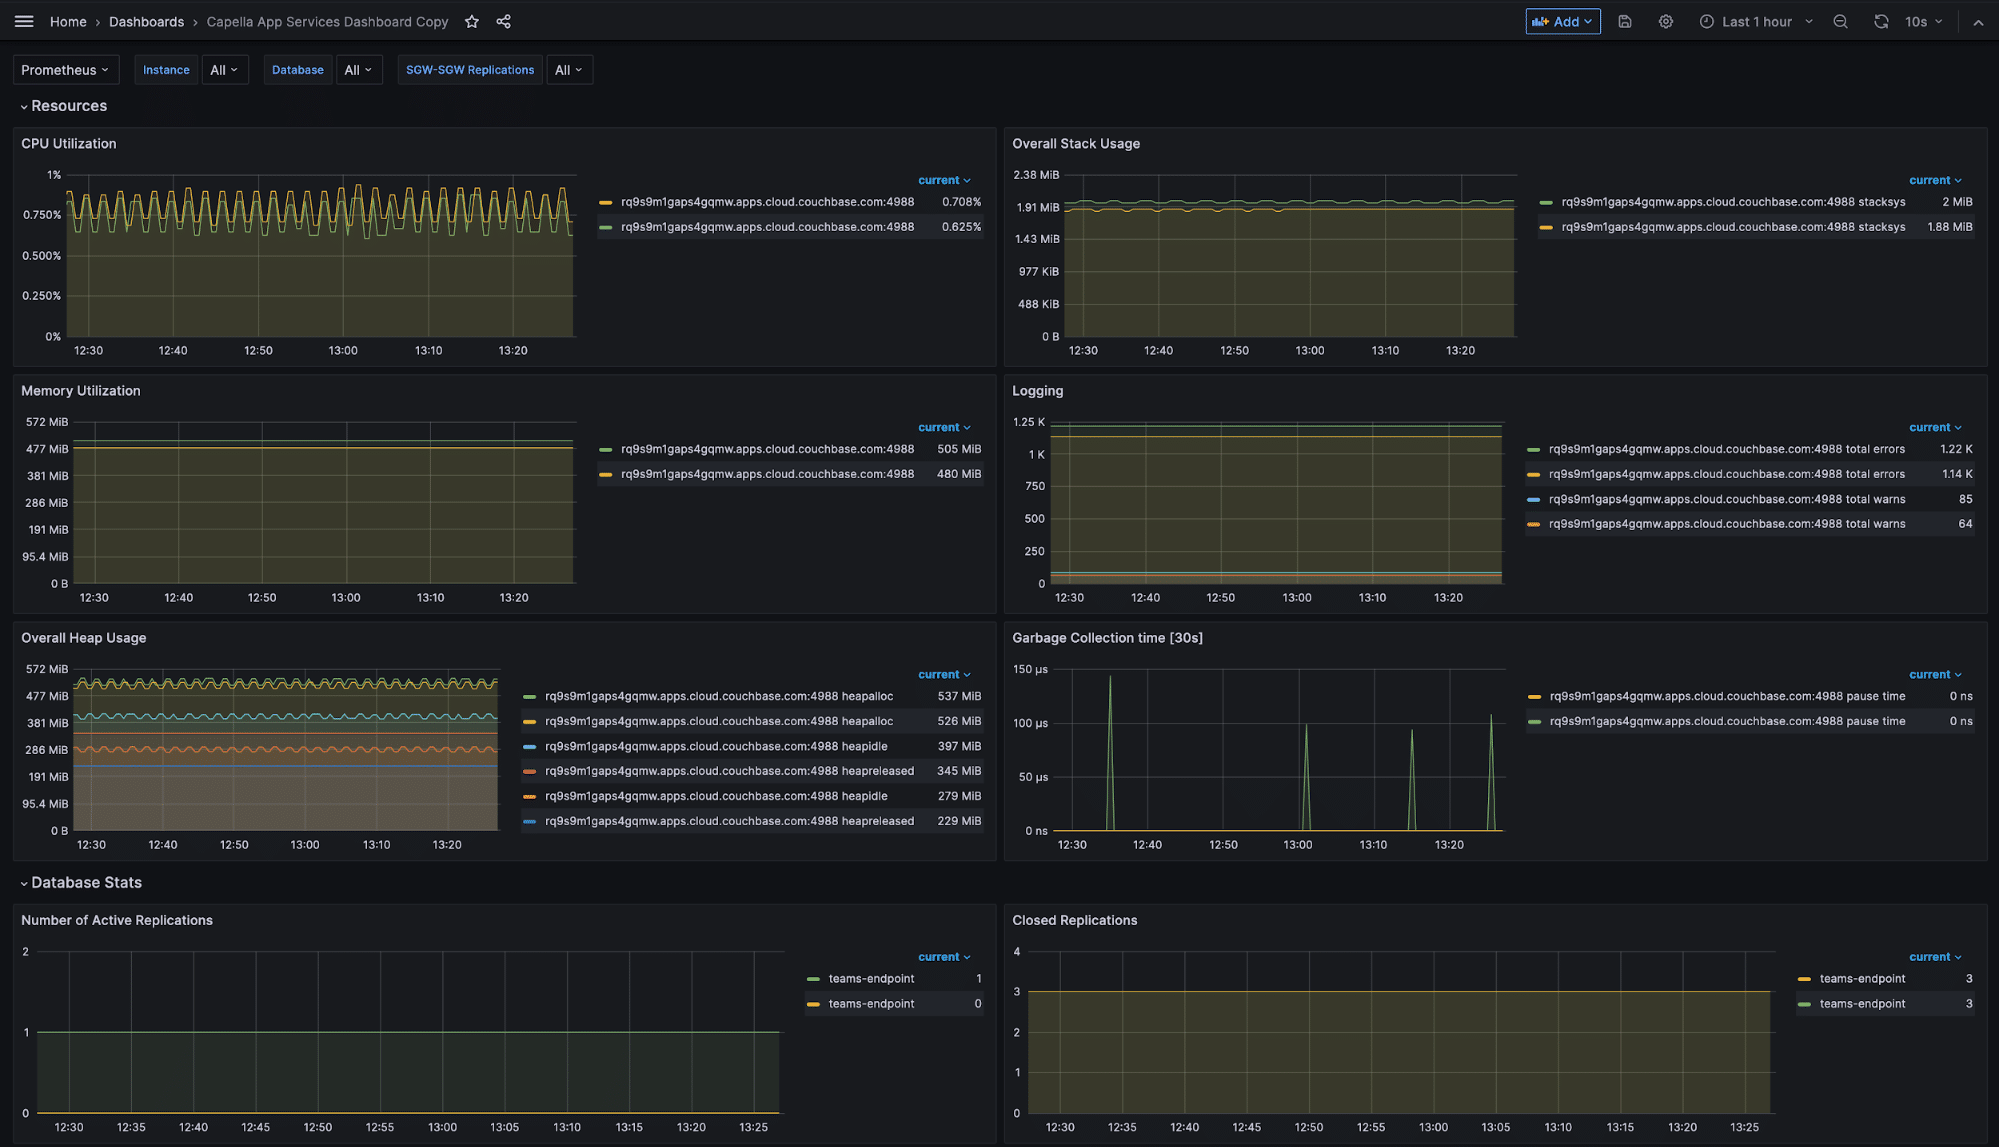
Once the connection is established with the Prometheus Data Source, we can proceed to build Grafana dashboards. To import a dashboard from the Grafana UI, go to the Dashboards section and click on Manage to access the dashboard management page. Click on Importar to import a new dashboard. Here is an example dashboard.json to get you started, which includes dashboards for most of the Metrics API core stats.
After the import process finishes, you will have the ability to view and interact with the imported dashboards within Grafana. These dashboards are connected to your containerized Prometheus server, which is configured as a data source in Grafana. To access the metrics, navigate to the Dashboards section and select the recently imported dashboard. In some cases, you may need to initially re-execute the queries associated with the dashboard to fetch the latest metrics.
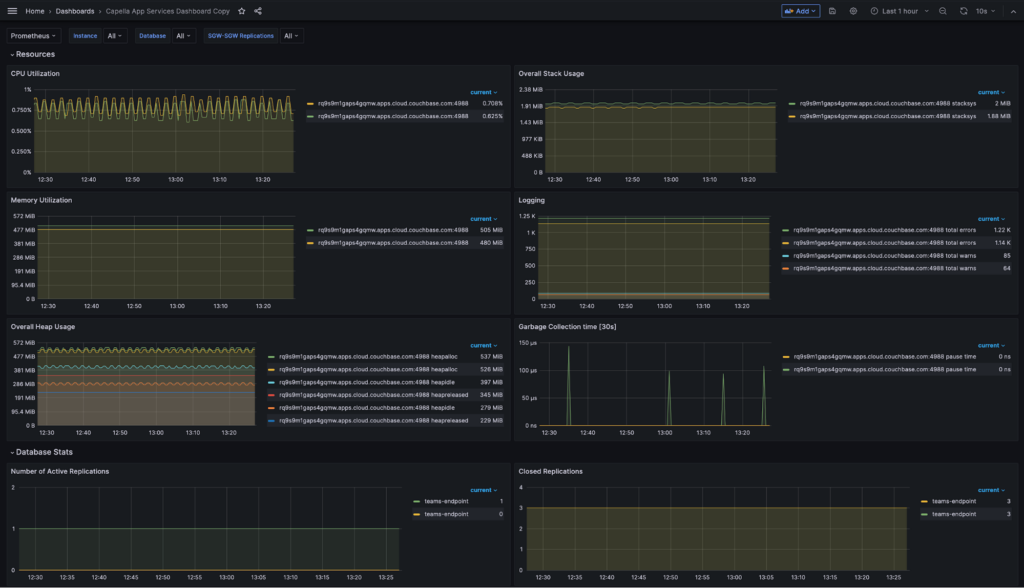
That’s it! You have successfully set up monitoring with Prometheus and Grafana for Capella App Services. You can now drive replications with Couchbase Lite clients and monitor it. The default Sync Gateway dashboard is a starting point. You can customize the dashboard, either by editing the dashboard.json file or directly through the Grafana UI.
Conclusión
In conclusion, the utilization of the Metrics API, coupled with the deployment of Prometheus and Grafana, allows for powerful, real-time monitoring of Capella App Services metrics. This integration equips you with the ability to promptly detect and address anomalies through custom alert rules, leading to enhanced application resilience. By harnessing these technologies, you can optimize performance and gain meaningful insights for your Couchbase applications.
If you have questions or feedback, please leave a comment below or feel free to reach out to me at iveta.dulova@couchbase.com. El Foros de Couchbase are another place where you can reach out to us. We value your thoughts and look forward to hearing from you.

Deja un comentario
Lo siento, debes estar conectado para publicar un comentario.