
Etiqueta: Grafana
-
Extracción de métricas de bases de datos desde Couchbase Capella con Prometheus
En esta publicación de blog, la primera de una serie, te mostraremos cómo configurar un servidor Prometheus y conectarlo a tu base de datos de Couchbase Capella para recopilar métricas.…
-
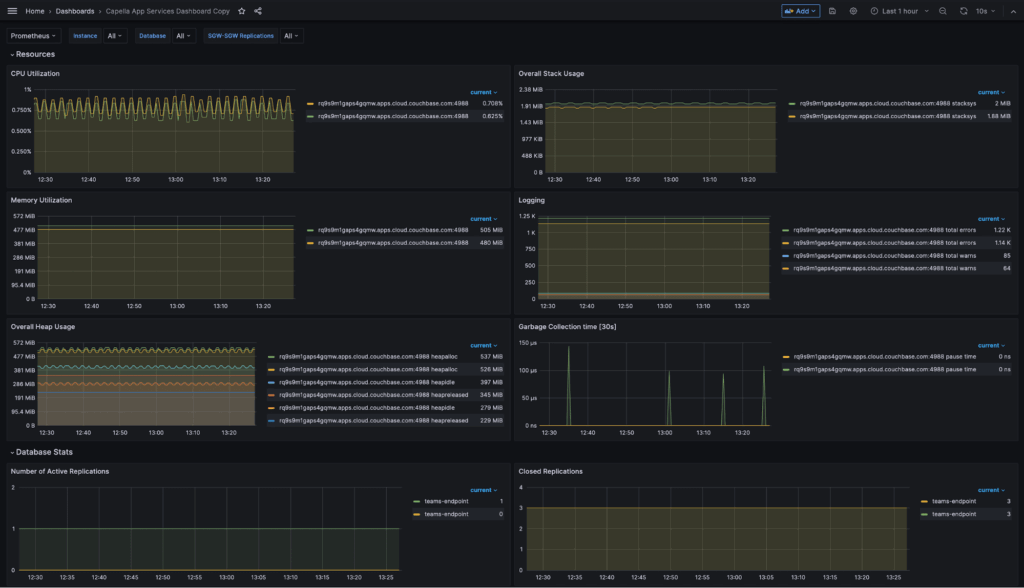
Cómo monitorear los servicios de la aplicación Capella con Prometheus y Grafana
Capella App Services is a fully managed backend as a service (BaaS), that is specifically tailored to mobile, IoT and edge applications. It empowers developers and organizations to seamlessly integrate with Couchbase Capella and…
-

Top Blogs of 2021 – Part 2
And now for Part 2 in our series, here are the top 5 blog posts published in 2021: 5. How we implemented distributed multi-document ACID transactions in Couchbase, by Denis Rosa In this blog…
-
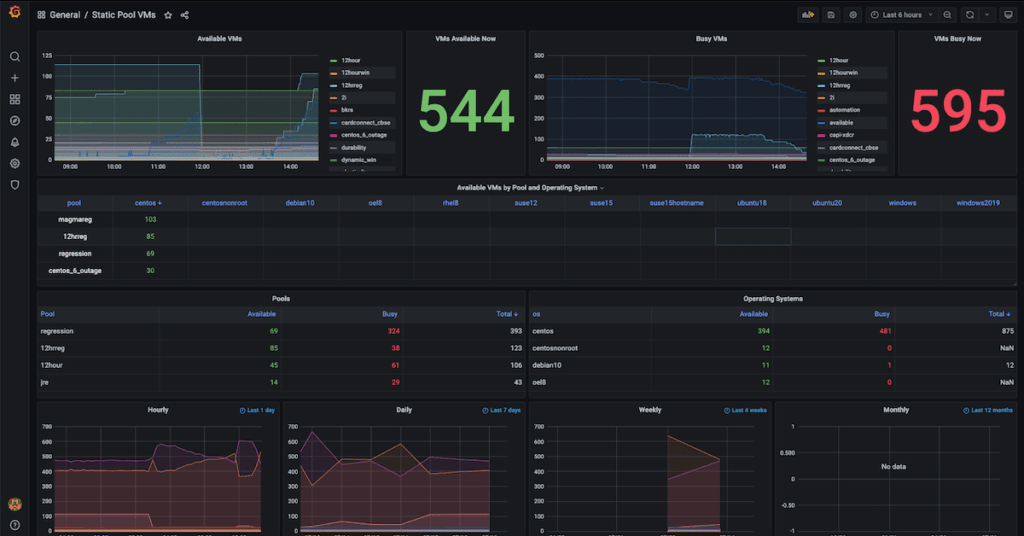
How to Build Observability Dashboards with Prometheus, Grafana & Couchbase
You’ve certainly heard it before: “What gets measured gets done.” It’s true: what you observe and measure is what you can improve. The key to any improvement is to first identify what to measure…
-
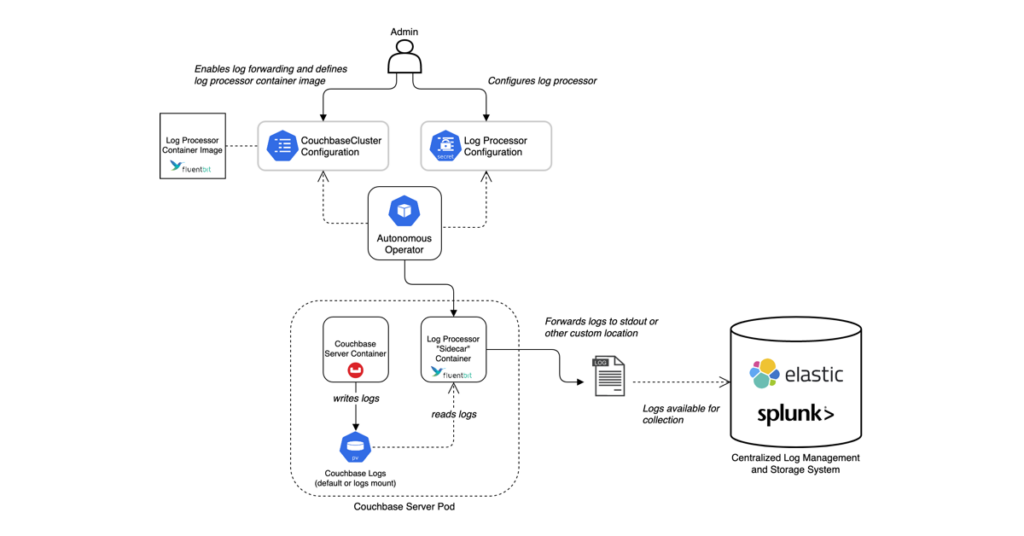
11 Fluent Bit Examples, Tips & Tricks for Log Forwarding with Couchbase
Log forwarding and processing with Couchbase is easier than ever. We have support for log forwarding and audit log management for both Couchbase Autonomous Operator (i.e., Kubernetes) and for on-prem Couchbase Server deployments. In…
-

Using Fluent Bit for Log Forwarding & Processing with Couchbase Server
With the recent release of Couchbase Autonomous Operator (CAO) 2.2, we have recently provided log processing and forwarding for the Kubernetes deployments using the OSS Fluent Bit tooling. This is also OSS and available…