

Kubernetes provides detailed insights about resource usage in the cluster. This is enabled by using Heapster, cAdvisor, InfluxDB e Grafana.
Heapster is installed as a cluster-wide pod. It gathers monitoring and events data for all pods on each node by talking to the Kubelet. Kubelet itself fetches this data from cAdvisor. This data is persisted in InfluxDB and then visualized
using Grafana.
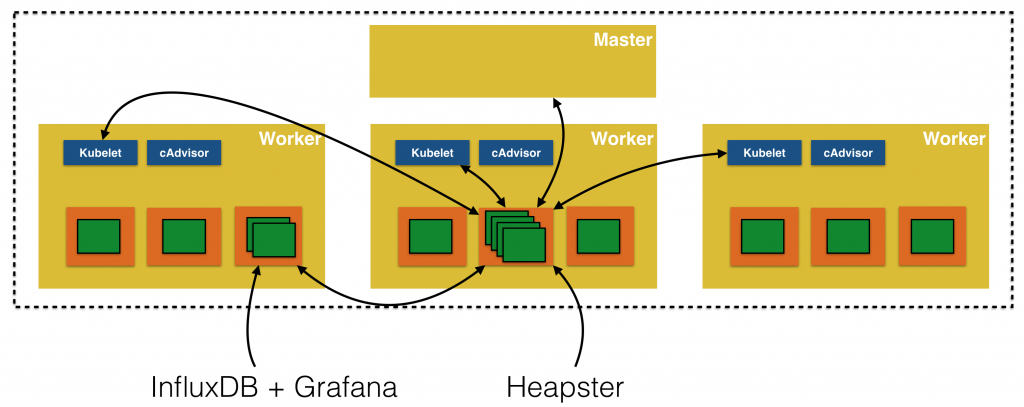
Resource Usage Monitoring provide more details about monitoring resources in Kubernetes. Heapster, InfluxDB and Grafana are Kubernetes addons. They
are enabled by default if you are running the cluster on Amazon Web Services or Google Cloud. But need to be explicitly enabled if the cluster is started using minikube ou
kops addons.
Start a Kubernetes cluster on Amazon Web Services as:
KUBERNETES_PROVIDER=aws; kube-up.sh
More details about starting a Kubernetes cluster are available at Getting Started with Kubernetes 1.4. By default, it creates a 4-node Kubernetes cluster in us-west-2a region. More details about the cluster can be seen using the command kubectl cluster-info and it shows the results as:
|
1 2 3 4 5 6 7 8 9 10 |
Kubernetes master é running at https://35.165.6.91 Elasticsearch é running at https://35.165.6.91/api/v1/proxy/namespaces/kube-system/services/elasticsearch-logging Heapster é running at https://35.165.6.91/api/v1/proxy/namespaces/kube-system/services/heapster Kibana é running at https://35.165.6.91/api/v1/proxy/namespaces/kube-system/services/kibana-logging KubeDNS é running at https://35.165.6.91/api/v1/proxy/namespaces/kube-system/services/kube-dns Kubernetes–dashboard é running at https://35.165.6.91/api/v1/proxy/namespaces/kube-system/services/kubernetes-dashboard Grafana é running at https://35.165.6.91/api/v1/proxy/namespaces/kube-system/services/monitoring-grafana InfluxDB é running at https://35.165.6.91/api/v1/proxy/namespaces/kube-system/services/monitoring-influxdb To further depurar e diagnose aglomerado problems, usar ‘kubectl cluster-info dump’. |
Note the URL for the Grafana service. Open this URL in a browser window. You’ll be prompted for an invalid certificate warning but this can be safely ignored at this time. In production system, appropriate certificates should be installed.
Then you’ll be prompted for credentials. These can be obtained using kubectl config view command. It will show the output as:
|
1 2 3 4 |
– nome: aws_kubernetes–basic–autenticação usuário: senha: ZeH4JpQzAtGDEBdb nome de usuário: admin |
Use the value from nome de usuário e senha fields. This shows the default dashboard:
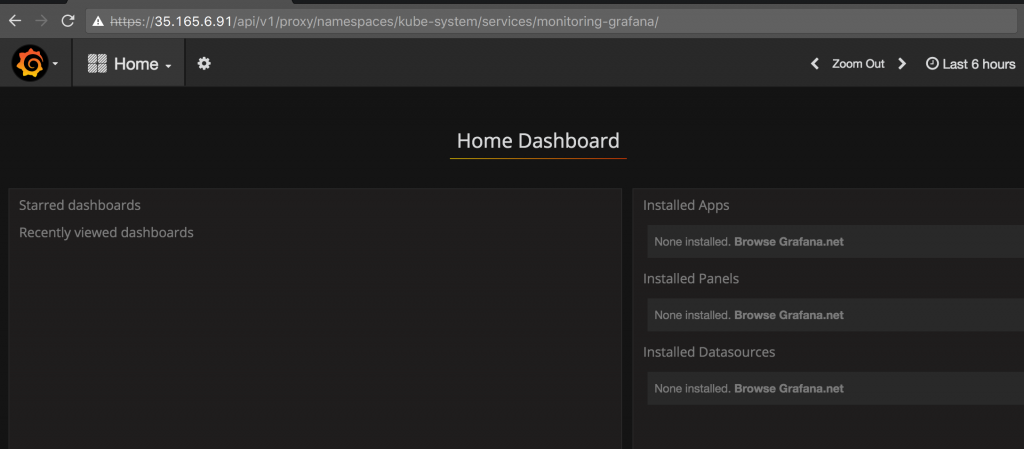
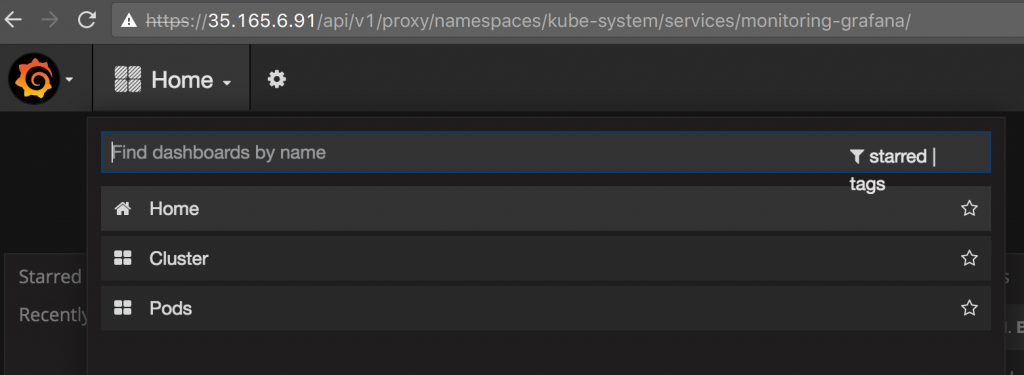
It consists of two dashboards – one for cluster and another for pods.
For this blog, a 4-node Couchbase cluster was created following the steps outlined in Create a Couchbase Cluster using Kubernetes. A cluster-wide
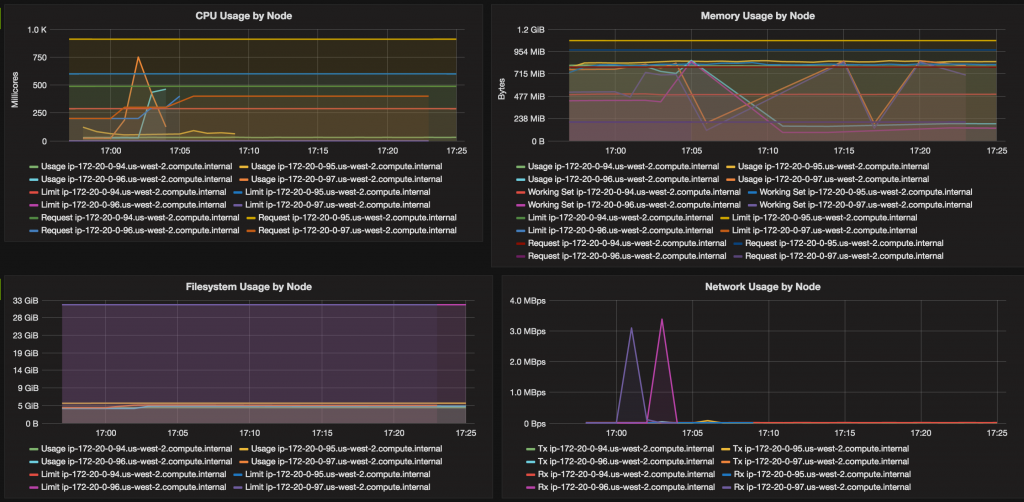
dashboard shows CPU, Memory, Filesystem and Network usage across all the hosts and looks like:
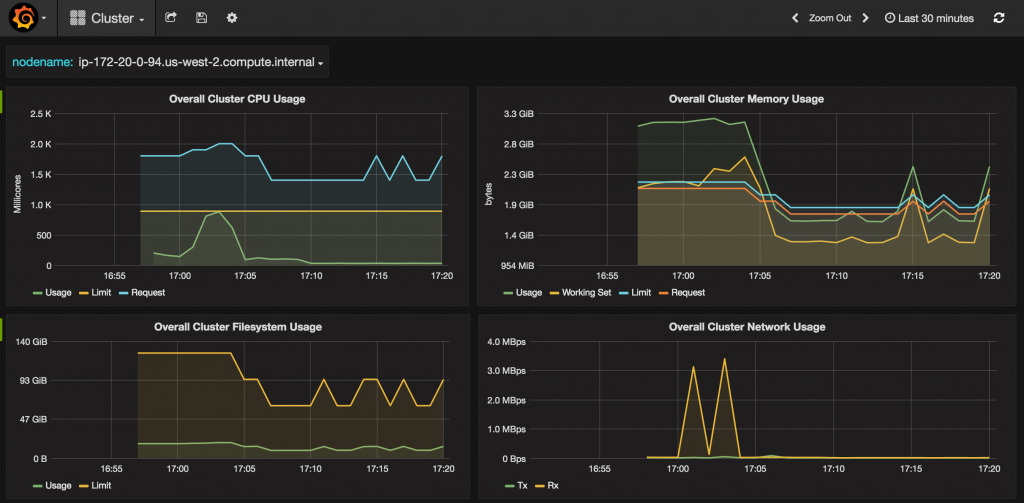
CPU, memory, filesystem and network usage for all nodes may be seen:
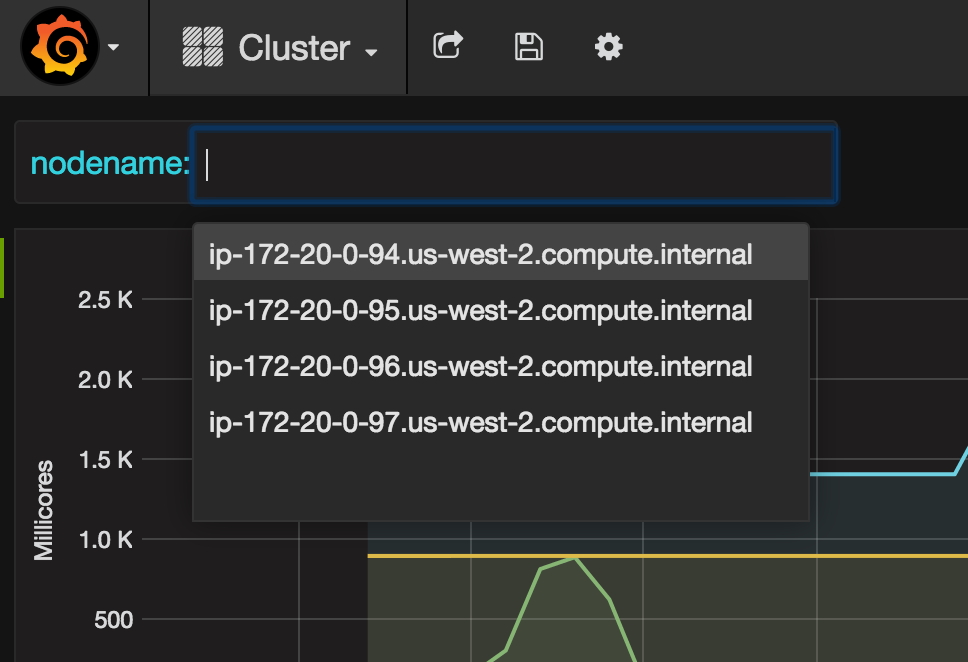
Details for each node may be seen by selecting the node:
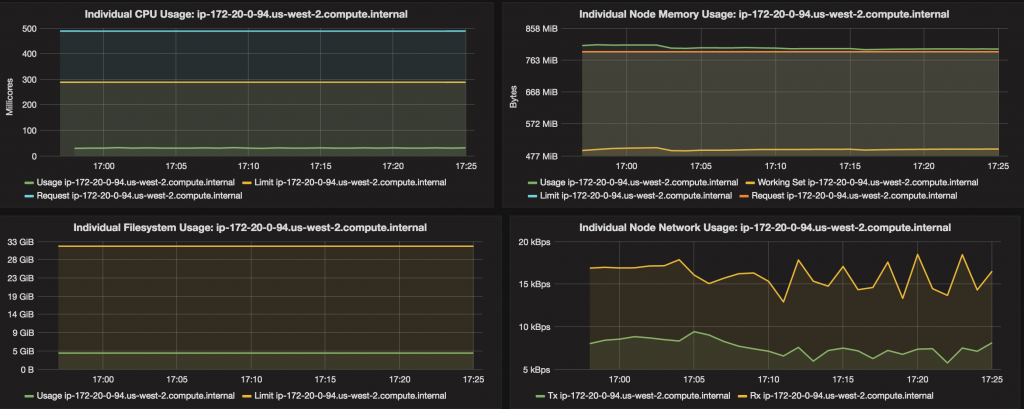
CPU, memory, filesystem and network usage for each node is displayed:
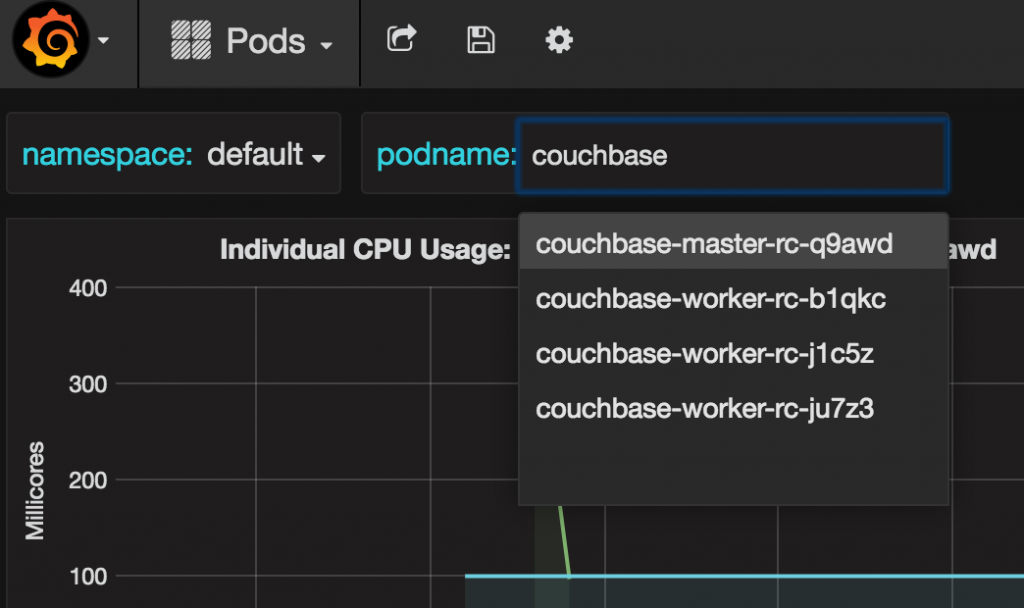
Pods dashboard shows CPU, memory, filesystem and network usage for each pod:
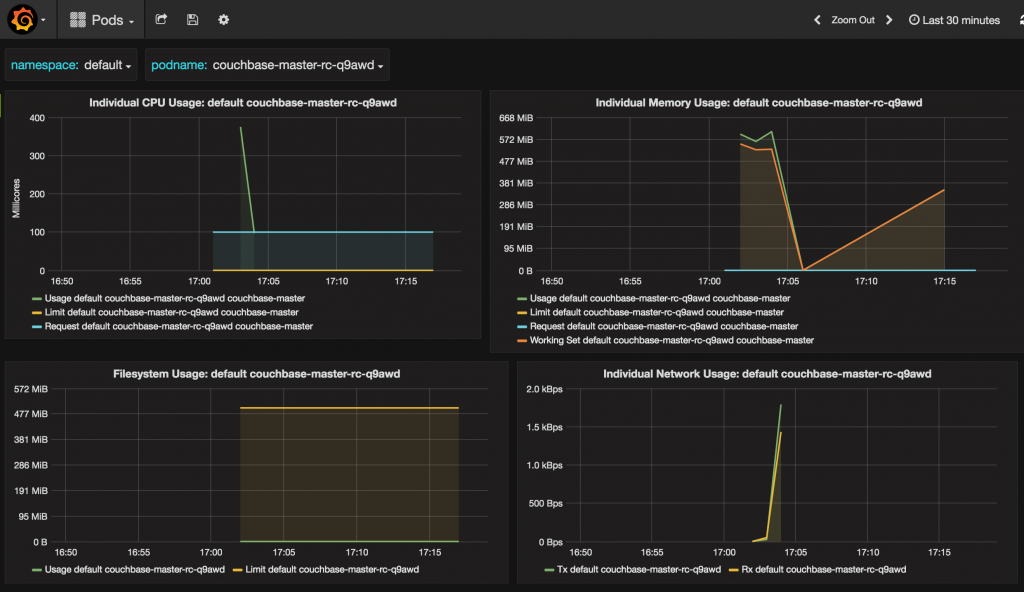
A different pod may be chosen:
A complete list of all services running in the Kubernetes can be seen using kubectl get services --all-namespaces command. It shows the output as:
|
1 2 3 4 5 6 7 8 9 10 11 |
kubectl.sh obter svc —todos–namespaces NAMESPACE NAME CLUSTER–IP EXTERNAL–IP PORT(S) AGE default Couchbase–master–service 10.0.70.206 aef06961eb8f3... 8091/TCP 1h default Kubernetes 10.0.0.1 443/TCP 1h kube–system Elasticsearch–logging 10.0.54.112 9200/TCP 1h kube–system heapster 10.0.146.18 80/TCP 1h kube–system kibana–logging 10.0.123.37 5601/TCP 1h kube–system kube–dns 10.0.0.10 53/UDP,53/TCP 1h kube–system Kubernetes–dashboard 10.0.146.179 80/TCP 1h kube–system monitoring–grafana 10.0.33.81 80/TCP 1h kube–system monitoring–influxdb 10.0.26.251 8083/TCP,8086/TCP 1h |
A complete list of all the pods running in the Kubernetes cluster can be seen using kubectl get pods --all-namespaces.
Some references:

Deixe um comentário
Você precisa fazer o login para publicar um comentário.