

Statistics in Couchbase Server has been the source of truth for understanding the performance, monitoring usage, and troubleshooting operations for administrators. In 6.5, we are making some integral updates to the display of stats in the Couchbase Server Web Console, with a focus towards making them more useful for troubleshooting in major production systems.
While the current stats provide real-time, second by second data depicting the status of Couchbase Server, we wanted to make it more informative, customizable, service specific, and better for troubleshooting.
What is new in 6.5 ?
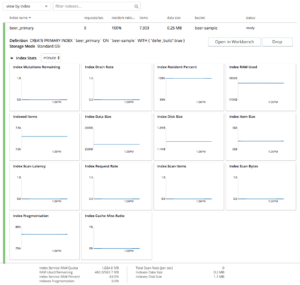
Visuals : The new line charts have intelligent x- and y-axes properly labeled and responsively sized for any screen from mobile phones to conference room monitors. All stats are named and described in a popup tooltips. .
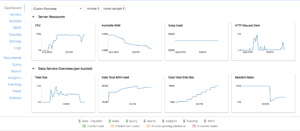
Display : Couchbase users have always been able to select time ranges like month, week, day, hour, or second to view and display stats. Now in the focused view of a chart, you can use a click-and-drag focus tool to select a custom range of data — zooming in on areas of interest. You can also toggle on and off the individual data feeds on your chart, be they individual nodes or individual stats. What, you ask? Read on…
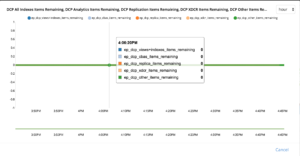
Aggregation : With the new stats framework, node data can be aggregated and then a single chart may display multiple stats in order to group related or contrasting stats. Or, one stat may be displayed on a chart with each individual node in the cluster represented separately, enabling quick troubleshooting of outliers.

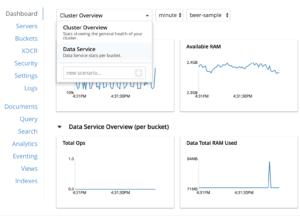
Customizable : Upon logging into the Couchbase Server Web Console, you will see a dashboard of general cluster stats. You can use this dashboard plus many more preset scenarios (dashboards), but you can also create your own scenarios and charts. Choose any combinations of Couchbase stats, services, and nodes (within reason!) in the new chart builder and then save them in customizable groups. Edit your charts any time you like and your changes are auto-saved.
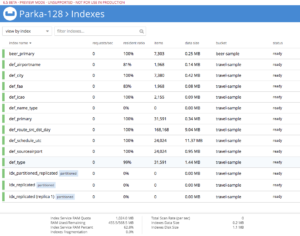
Service Specific Stats : Web Console pages displaying GSI indexes, Full Text Search indexes, XDCR replications, Eventing functions, and N1QL/Analytics queries will all display their respective statistics inline with their lists of indexes/queries/etc. Service level stats will also be displayed on those pages in a separate footer.
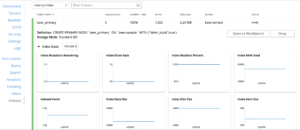

Scalability : For services like Indexing which can have very large stats collections depending on the number of indexes, this new design lets you find and view the stats you need, index by index, without being overwhelmed visually (or in CPU cycles) by thousands of simultaneous stats.
We believe all these improvements made to stats will aid you with better visualization, monitoring, and especially short-term troubleshooting. Couchbase Server has always had a robust collection of fine-grained stats and now they are at your fingertips in a flexible, modern stats framework that lets you get on with your job quicker, with less mystery and more clarity!
Please share any feedback you have by commenting below.
자원
다운로드
문서
블로그
Blog: Announcing Couchbase Server 6.5 – What’s New and Improved

댓글 남기기
댓글을 달기 위해서는 로그인해야합니다.