Hi
for more than 12 hours the network traffic between CB/SG nodes is consistently high. As a result of that syncing documents between clients takes minutes. Initial sign up won’t work with my logic as documents won’t get pulled down in time.
Some SG logs are:
20:39:08.116844 2016-11-02T20:39:08.116+01:00 Cache: Received #13766535 after 1309ms ("bc68be85-fdd4-4c28-ac57-767a3792b46f" / "2305-1111462567bf9a4da45324032c0d7247")

20:39:08.117074 2016-11-02T20:39:08.117+01:00 Cache:   Deferring #13766535 (25 now waiting for #13766483...#13766483)

or

} --> 403 missing cannel access

20:35:45.782171 2016-11-02T20:35:45.782+01:00   BulkDocs: Doc
"108784756223793860738_a50ba289-f59e-42f6-8e45-c3a4b0b8b2f3_tDictionary"
 --> 403 missing channel access (403 mssing channel access)

or

21:03:10.379071 2016-11-02T21:03:10.379+01:00 Cache:   Deferring #13774732 (40 now waiting for #13774597...#13774597)

21:03:10.379960 2016-11-02T21:03:10.379+01:00 Cache: Received deduplicated #13774680 for ("100748874246403440004_tDictionary" / "577-daa1c5f87c6f6dc045a93960655e5971")

21:03:10.380034 2016-11-02T21:03:10.380+01:00 Cache: Received deduplicated #13774683 for ("100748874246403440004_tDictionary" / "577-daa1c5f87c6f6dc045a93960655e5971")

21:03:10.380055 2016-11-02T21:03:10.380+01:00 Cache: Received deduplicated #13774685 for ("100748874246403440004_tDictionary" / "577-daa1c5f87c6f6dc045a93960655e5971")

21:03:10.380071 2016-11-02T21:03:10.380+01:00 Cache: Received deduplicated #13774687 for ("100748874246403440004_tDictionary" / "577-daa1c5f87c6f6dc045a93960655e5971")

21:03:10.380096 2016-11-02T21:03:10.380+01:00 Cache: Received deduplicated #13774689 for ("100748874246403440004_tDictionary" / "577-daa1c5f87c6f6dc045a93960655e5971")

21:03:10.380116 2016-11-02T21:03:10.380+01:00 Cache: Received #13774692 after 2028ms ("100748874246403440004_tDictionary" / "577-daa1c5f87c6f6dc045a93960655e5971")

21:03:10.380133 2016-11-02T21:03:10.380+01:00 Cache:   Deferring #13774692 (41 now waiting for #13774597...#13774597)

21:03:10.380296 2016-11-02T21:03:10.380+01:00 Cache: Received #13774702 after 771ms ("115509364005524957017_tPrice" / "2-26cb84d3d34236b7086f084dcb1c71cc")

21:03:10.380332 2016-11-02T21:03:10.380+01:00 Cache:   Deferring #13774702 (42 now waiting for #13774597...#13774597)

21:03:10.382377 2016-11-02T21:03:10.382+01:00 Cache: Received #13774701 after 777ms ("115509364005524957017_tDictionary" / "2-d9b32d02816cbfe9dfc51ea0e179e95a")

21:03:10.382432 2016-11-02T21:03:10.382+01:00 Cache:   Deferring #13774701 (43 now waiting for #13774597...#13774597)

21:03:10.383130 2016-11-02T21:03:10.383+01:00 Cache: Received #13774514 after 28707ms ("2eea8abc-99f1-4b11-a4a0-e00bdcb924de" / "2658-d518aea739cc1d9ddc29d80b386b4f44")

21:03:10.383215 2016-11-02T21:03:10.383+01:00 Cache:   Received
previously skipped out-of-order change (seq 13774514, expecting
13774597) doc "2eea8abc-99f1-4b11-a4a0-e00bdcb924de" /
"2658-d518aea739cc1d9ddc29d80b386b4f44"
The network traffic increase started at one point without making any changes to the cluster. The cluster setup is:
1x nginx loadbalancer
3x CB 4.1 CE + SG 1.3.1
All machines have 8 CPU cores and 24 GB RAM and SSDs
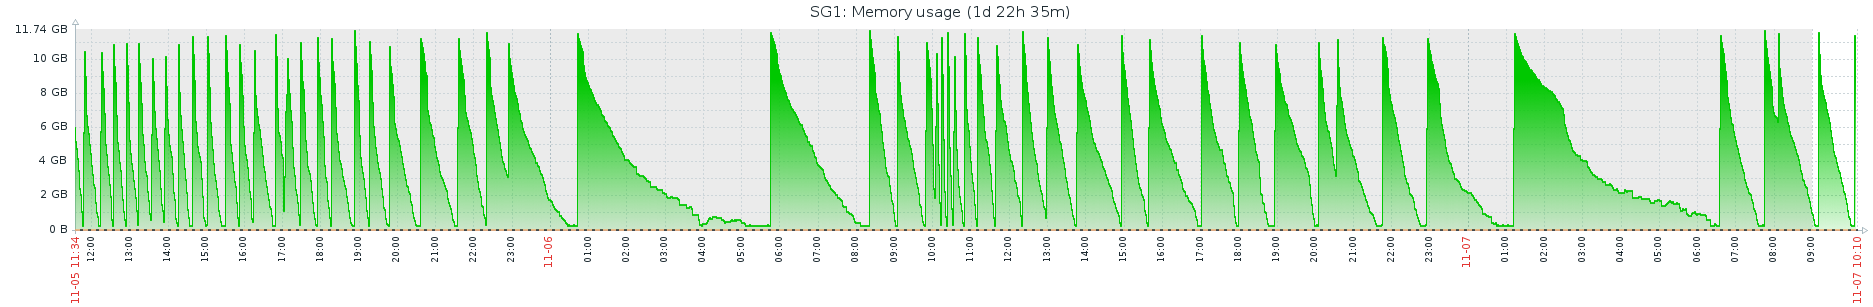
Ops/s are less than 100 at the moment. RAM is normally at around 15% on the CB/SG nodes but it slowly fills up and is at over 60% now.
I tried restarting services and machines with no luck.
I’m looking forward to hearing from you and what I can do to resolve the problem.
Regards
Benjamin Glatzeder