

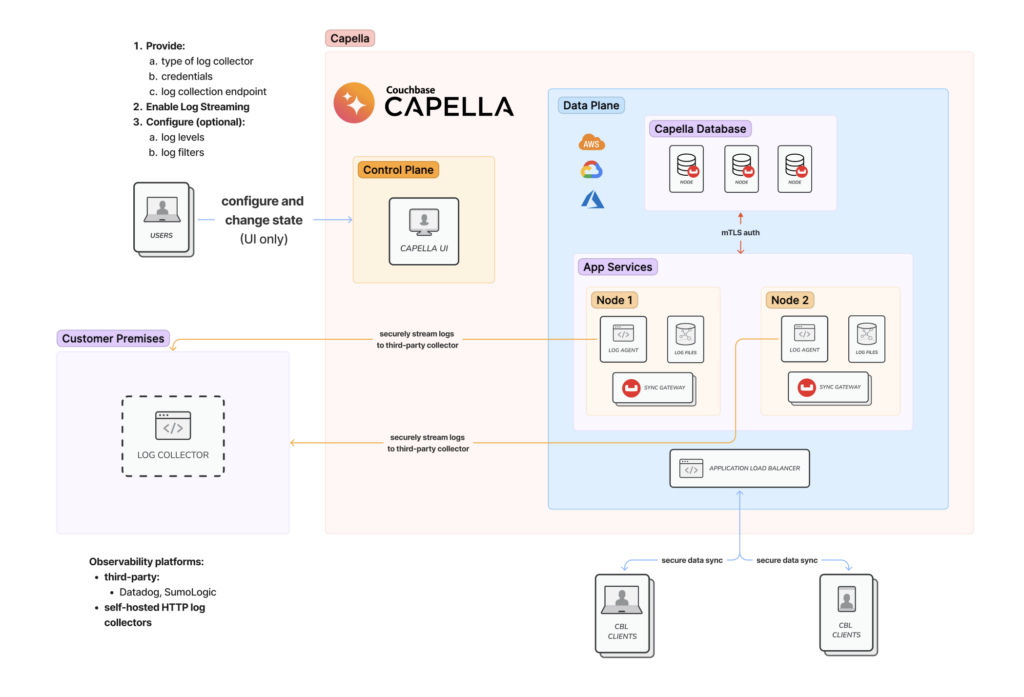
In an earlier post, we discussed the fundamentals of the Log Streaming feature on Capella App Services. App Services logs can be streamed in real-time to third-party observability platforms such as Datadog or collectors, hosted in customer premises.
로그 스트리밍을 통해 애플리케이션 동작에 대한 즉각적인 통찰력을 얻을 수 있으므로 신속한 문제 감지 및 해결이 가능합니다. 이 기능 enhancements는 애플리케이션의 신뢰성, 가용성 및 보안을 향상시키는 데 핵심적인 역할을 합니다.
In this blog post, I’ll guide you on how to easily stream logs from App Services to Datadog’s Log Management solution to enable log collection, parsing and normalization, visualization and proactive logs analysis.
This blog post assumes you are familiar with the capabilities of real-time Log Streaming in App Services. If you need a refresher, catch up with the first part of this blog on 카펠라 앱 서비스(Capella App Services): 실시간 로그 스트리밍 지원을 통한 관측 가능성 향상.
전제 조건
튜토리얼을 시작하기 전에 다음 전제 조건이 충족되었는지 확인하십시오.
- 배포된 Capella 앱 서비스 그리고 구성된 앱 엔드포인트.
- Datadog 계정. 계정이 없으신 경우 가입하실 수 있습니다. 여기.
- 참고: 로그 스트리밍을 사용할 수 없습니다: 카펠라 시련.
Real-time log streaming from Capella App Services to Datadog
Datadog is a leading cloud-based monitoring and analytics platform that aids in observing, troubleshooting, and optimizing their applications’ performance. Within the context of this tutorial, we’ll focus on Datadog’s capabilities of logs monitoring.
Logs are essential data streams that capture event-specific details about software applications, systems, and platforms. By monitoring logs in real-time, teams can gain immediate insights into system behaviors, spot anomalies, troubleshoot issues, and ensure optimal system health.
Streaming real-time logs offers visibility into the operations of your applications and is simple to set up. By connecting Couchbase’s 카펠라 앱 서비스 to Datadog and utilizing App Services Log Streaming, you can have a centralized place to store your logs, that supports advanced processing and normalization, visualization and dashboards as well as alerting.
This integration not only simplifies the setup process but also enhances the ability to monitor, analyze, and respond to the logs your applications generate, ensuring proactive insights extraction and issue resolution.
How to set up log streaming to Datadog
Step 1: Setup in Datadog
- Log in to your Datadog account.
- Navigate to Logs.
- Look for the ‘Logs’ section in the Datadog dashboard.
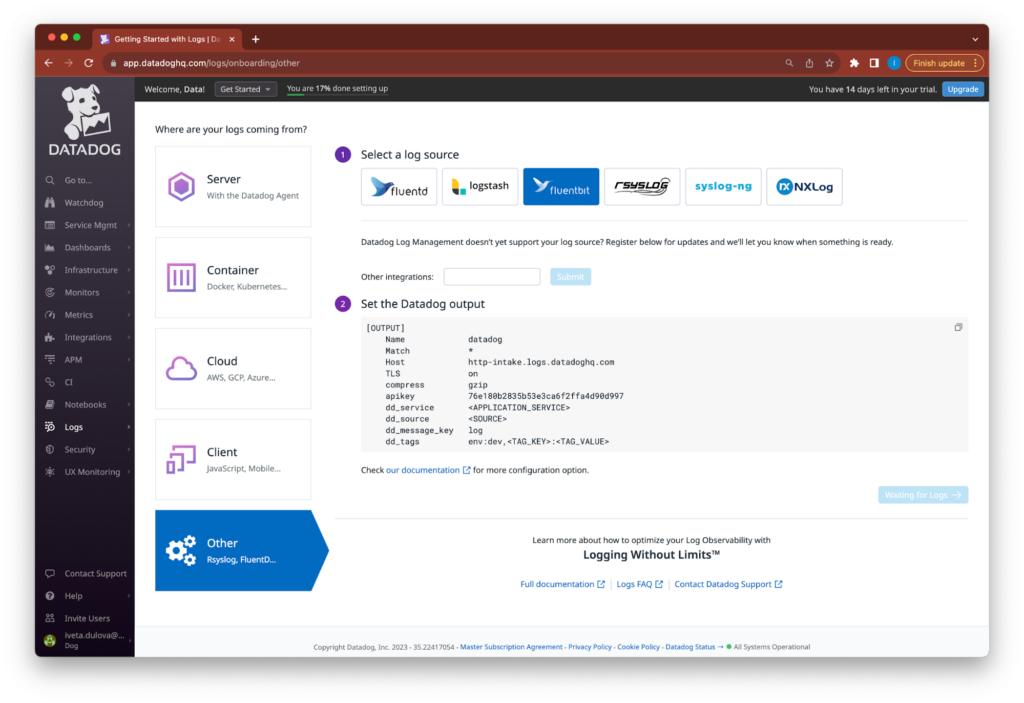
- Select Fluent Bit as your log source.
- This will show you the details you’ll need to set up streaming from Capella App Services. Specifically, you will see:
- Host Address: This is the endpoint where the logs will be sent.
- API Key: An authorization token to authenticate your log streams.
- This will show you the details you’ll need to set up streaming from Capella App Services. Specifically, you will see:
Step 2: Setup in Capella App Services
- Log in to your Couchbase Capella dashboard.
- Navigate to your App Service’s Settings page.
- Find and select the Log Streaming option.
- Here, you’ll configure where and how your logs will be sent.
- Configure Datadog as your Log Collection Provider:
- For Collection URL, enter the Host Address you obtained from Datadog.
- 안에 Access Credentials, input the Datadog API Key you noted earlier.
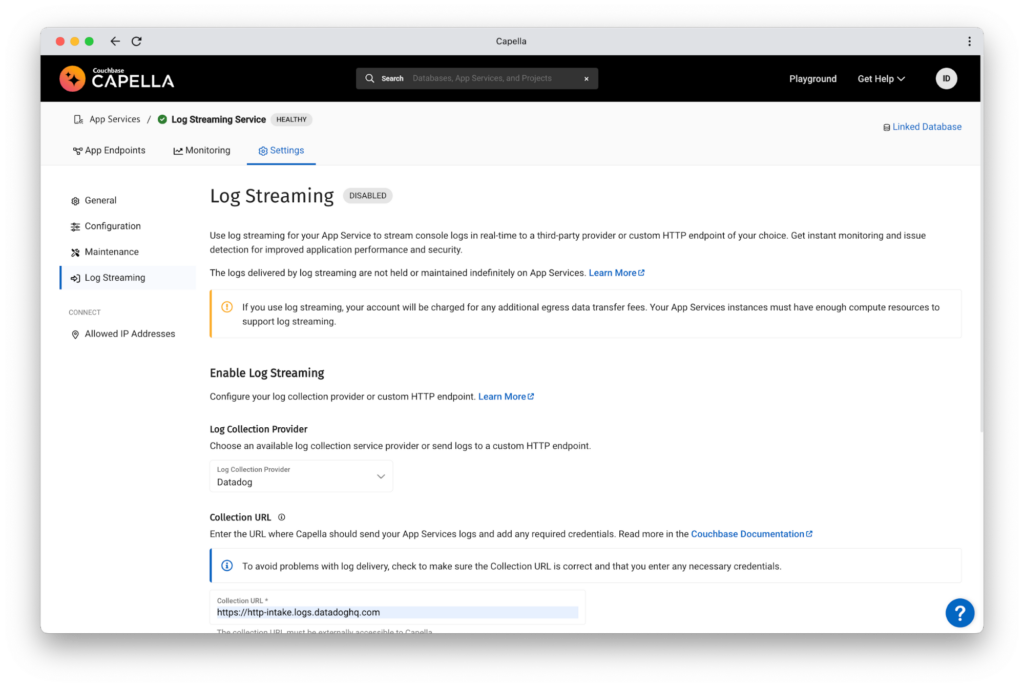
- Enable Log Streaming:
- Click on the option to enable log streaming. This might take a moment as it sets up the collector.
- Monitor the status. Once fully set up, you should see the status transition to “Enabled”, indicating that logs are now streaming from Capella App Services to Datadog.
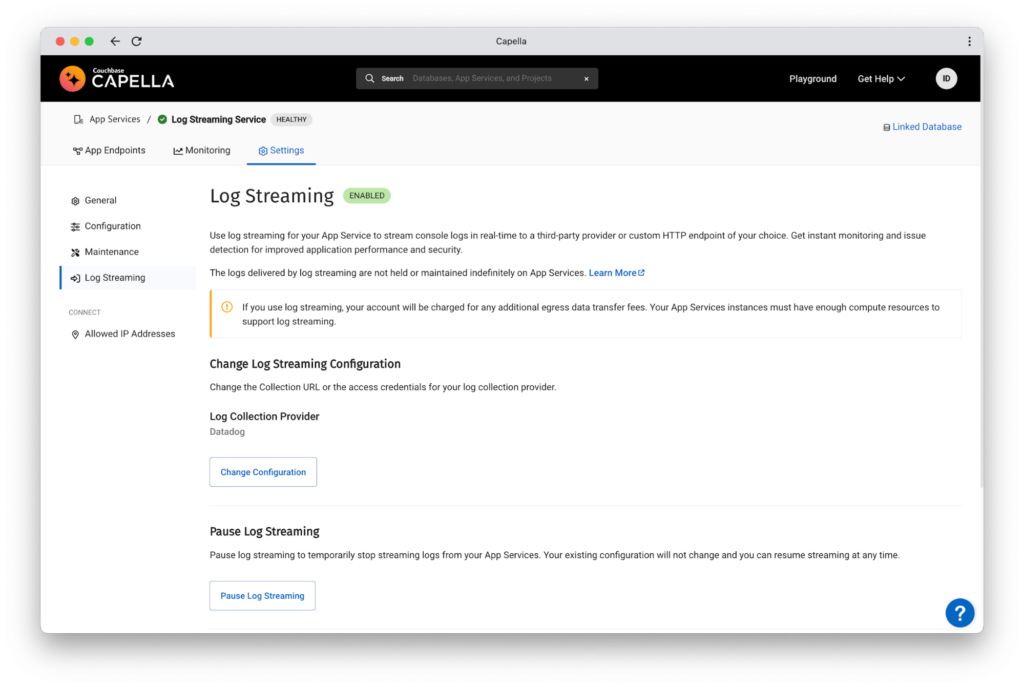
- Once enabled, App Services Log Streaming can be then disabled or paused.
- Pausing temporarily stops streaming logs to the log collector until streaming is resumed.
- Disabling stops the streaming of logs and clears the configuration.
- Configuration can also be changed if any of the log collector’s target URLs or secrets change.
- (Optional) Powerful App Endpoints level configurability
- Variety of advanced Log Filters can be configured such as Auth, Import, Sync and many more to enhance the log types that are captured and streamed.
- 그 Log Level (e.g. Info, Warning and Error) can also be altered for a given App Endpoint.

Step 3: View and Analyze Logs in Datadog
- Go back to your Datadog dashboard.
- Navigate to the ‘Live Tail’ section within ‘Logs’.
- This section gives you a real-time view of incoming logs.
- You should now see a real-time stream of logs coming in from Capella App Services.

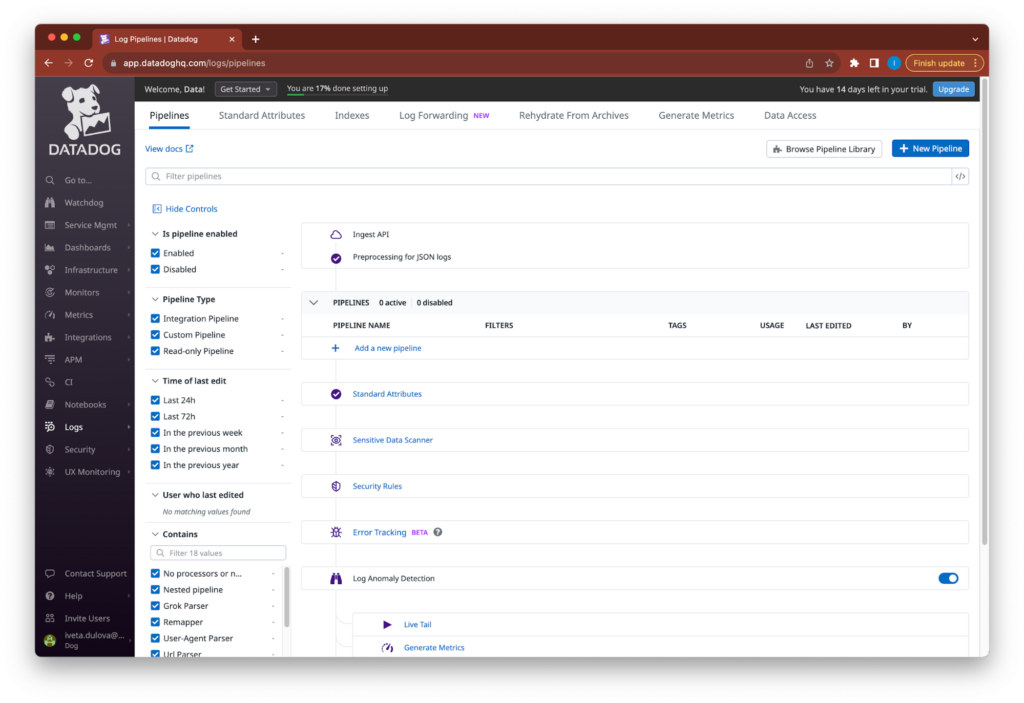
- (Recommended) Set up a Datadog Logs Pipeline:
- This is beneficial if you want to translate the logs from App Services into a common format that suits your monitoring needs within Datadog. Follow Datadog’s documentation or guidelines on how to set this up based on your specific requirements.
마무리
Congratulations! You’ve now successfully set up real-time log streaming from Couchbase Capella App Services to Datadog. You can now monitor, analyze, and act upon the insights you gain from your logs. Remember to keep an eye on your logs and set up any alerts or further integrations as needed to maximize your monitoring capabilities.
What’s Next
In this post we described the fundamentals of real-time Log Streaming in Capella App Services . In a future post, we will go through a step-by-step tutorial on how to easily stream App Services operational logs to Sumologic. Stay tuned!
질문이나 피드백이 있으시면 아래에 댓글을 남겨주시거나 이메일을 보내주세요. . 카우치베이스 포럼 또는 디스코드 질문을 하기에는 또 다른 좋은 곳입니다.
Capella 앱 서비스 로그 스트리밍에 관한 이 시리즈의 나머지 게시물들을 확인해 보세요:
- Capella App Services: 실시간 로그 스트리밍 지원을 통한 관측 가능성 향상 [제1부]
- Capella 앱 서비스: Datadog으로 실시간 로그 스트리밍 [제2부]
- Capella 앱 서비스: SumoLogic으로 실시간 로그 스트리밍 [제3부]

댓글 남기기
댓글을 달기 위해서는 로그인해야합니다.