I routinely see XDCR routes getting “stuck”; that is there are pending mutations, but the replication rate is at 0. Once in this state, the problem persists, even if all load stops. AFAIK the only fix is to delete the problematic XDCR routes and re-create them.
Has anyone else seen something like this, or found a need to recreate XDCR routes frequently?
Here are additional details:
We’re using 3.0.1 Community Edition (build-1444) and XDCR version 2 (xmem). All servers are virualized and have 8 vCPUs each. There is plenty of free disk space and RAM in each bucket.
I’ve noticed that this typically happens when the system is under load (put/delete operations).
There are three buckets in the system. The problem usually occurs when one bucket is busy (~2k ops/second) and the others are more or less idle (a few ops/minute). The busy bucket never seems to get stuck, but the idle buckets do every few minutes.
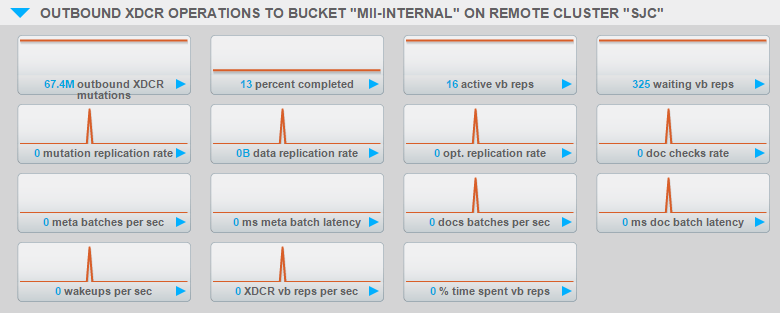
Here’s a screen cap showing what I refer to as a “stuck” XDCR route… Note that this typically only happens from one of the 3 nodes in the cluster; but it’s not always the same node.
- Under light load (~500 rps) we don’t see this problem
- We have an interesting topology: two main clusters of 3 nodes each,
connected with bi-directional XDCR. Then each main cluster fans out
with XDCR to several single-node “edge” instances on 3 buckets, and
one of those buckets also now has bi-directional XDCR set up back to
the main cluster. We believe we have seen these stuck routes however
even before setting up the bi-directional XDCR on that bucket. - When we write key/value pairs to CS, we use persistTo=0,
replicateTo=1. We wouldn’t expect this to affect XDCR, but it does
mean our ingest rates are lower than if we did not specify any
durability constraints. - In our experience, the “high load” can take many different forms. In
our most recent tests where we have the best data, we have been
writing values into “edge” instances and relying on XDCR to replicate
the values to the main clusters and out again. In previous tests, we
have done batch loading directly into the main clusters, or written
custom code to simulate load. It seems that no matter how we generate
the load, we still end up with stuck routes. - Under this “high load” we see CPU rates over 80% according to the CS
“minute” UI, but even under “light load” it can be around 70%. - The docs simple key/value pairs and are all very small (under 1KB)
Any help would be greatly appreciated. Thanks in advance!