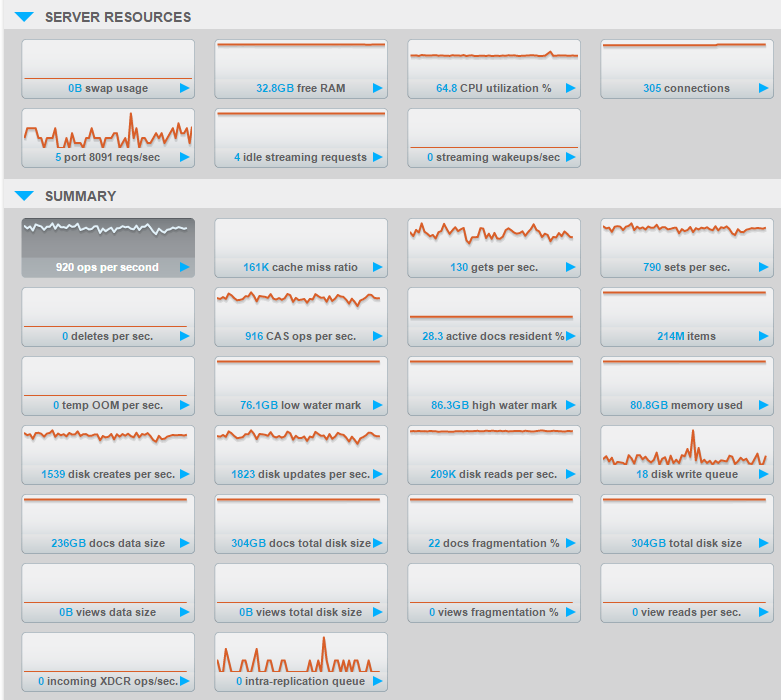
We’re seeing some odd stats in the couchbase UI. We’ve just switched to full eviction as we have a huge amount of data to store and a low number of reads.
Since we made the switch, we’ve seen very high reads per sec. That’s not necessarily a bad thing, but it stays high even when there are no incoming operations.
Also the cache miss ratio spikes in to the millions… of percent?? CPU is also quite high considering we’re only currently doing 50 ops/sec max. (we’ve turned off the main source of data whilst we look at things more closely.)
I forgot, even with 200k reads, the nodes themselves report minimal actual disk IO (0-50KB sec), checked with iotop. But the CPU on the nodes is indeed quite high.
We are not seeing this on any of the other deployments.
You have a high number of connections so my guess is you have something else accessing the env that has retry logic. you can do a wireshark to see for sure but quick test would be to drop your default bucket. Create a new bucket with password and see if you still see the behavior.
thanks
-cihan
Thanks for getting back to me, it’s much appreciated. As far as I know all the connections are coming from one app server using the .net libraries. I’ll run wireshark to confirm, but a quick check in iftop doesn’t show anything out of the ordinary.
It’s encouraging that you’ve not seen this before, hopefully it’s something in our implementation. The only odd thing is that the behavior continues when we stop our app. Again, wireshark will confirm any oddities. We set a password on the bucket earlier today as it happens, and that hasn’t made a difference.
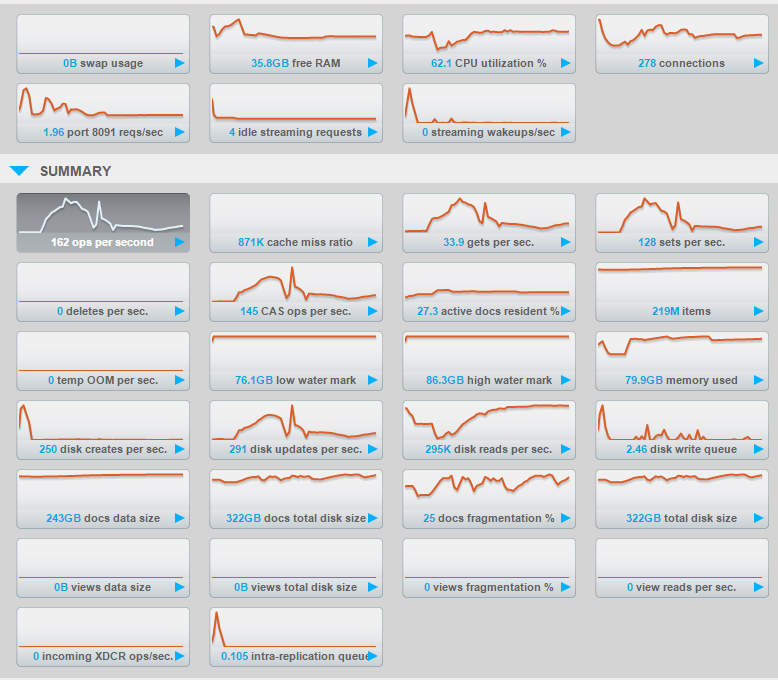
We are currently experiencing the exact same thing. Very high number of disk reads per sec (120k when there are just 5 ops per second) with 100% cache miss ratio after enabling full ejection. Did you figure out how to resolve this?
We are using Couchbase CE 4.0.0 in a 5 node cluster without XDCR.