Memory consumption increased significantly after rebalance

I run 4.6 community version. i ran only data service. my documents are legacy, binary documents.
my ep_kv_size is 62G (per node which means the whole size is about 620G. In fact currently my cluster occupies 1T which is unreasonable)
Added screen shots of cbstat memory (from some reason I cannot get allocators data i get an empty result)

Ok, so from your numbers is appears that bucket has 63GB used by the Data Service, and the total machine memory usage is 101G. I’d next suggest looking at top or similar and seeing exactly which process(es) are consuming that (RSS).

cbstats allocator not working sounds strange - exactly which build of 4.6 and which OS are you running on?

I’m running Ubuntu 14.04.5 LTS
Couchbase Version: 4.6.0-3453 Enterprise Edition (build-3453)
here is my top command it appears that memcached occupies 100G

Suggest you open a support case then - Couchbase technical support will be able to help you much better.

@gelibter

I think that currently your looking for a tactical solution(right now solution) vs a strategic(longer plan).

In you posted info on your kernal setting. I do see that you are using SWAP. What is your swappiness set at?
Here is a link on OS settings you might want to change
BASIC: Often Overlooked Linux OS Tweaks - The Couchbase Blog
ADVANCED: https://www.couchbase.com/resources/presentations/tuning-couchbase-server-the-os-and-the-network-for-maximum-performance.html

Thanks, my swapiness is set for 0. I set it to back to 0 after i noticed the swap usage increases after restarting the node on previous issues.
I agree that in right now the best tactical solution is XDCR as you mentioned earlier.

1.How Many buckets do you have?
2.How Many Replicas do you have per bucket?
3.What percentage of your active data is in memory?
4.What percentage of your replica data is in memory?
— If for answers for 3 & 4 are below 20-30% you might be a good candidate for FULL VALUE EJECTION bucket type.
5.Whats your use case?

  1. 1
  2. 1
    3-4. 41% - 0% cache miss ratio, even when this value was previously on 20%
  3. many gets and set, about 70K ops per second.

Thanks

Is the 41% - 0% your cache miss ratio?(IMAGE BELOW)

or is it 41% active and 0% replica.(IMAGE BELOW)

21 AM

Your showing about 100GB used vs 62 GB of Data.

If you have a high mutation rate the 100GB vs 62GB could be b/c of memory fragmentation is memcached which is normal.
Also is 62GB active data only or Active + Replica Data ???

Let me tell you that i restarted all the nodes a few days prior the rebalance , and reset my cluster (all was normal without excessive memory consumption). it was way to large so i removed 2 nodes, and rebalanced ending up in this state.

I’ll use XDCR and see how it goes, if you have more ideas how work it I’d be happy to hear.

@gelibter,

Your cluster looks normal to me. Looks like your not factoring your META data for each key in your memory allocation.

If you look at you VBUCKET RESOURCES you have 559GB of Data and 152 GB of Meta data. = 711GB

Here is an example of what a document looks like in Couchbase.

Your Swap usage is not good for rebalancing though. but if you set it to swappiness=0 it should slowly release swap.

You might want to give your bucket some more space of your 122 GB if you want more if it in RAM.

I cannot! 100G is already used by memcached!

something sound very weird to me with the ram requirements you suggest here.
if you look carefully in the data you will see that my working set => the actual data my application needs is less than 250G. all i actully need is 250G ram the rest can be brought from the disk according to the LRU algorithm.
the problem is that this cluster cannot perform rebalance while the application is up. so what you actually
saying is if you want to rebalance you must have 1.3T+ cluster?! isnt that sound exaggerated?!

@gelibter,

If you look at:
Doc Data Size(650GB) vs you doc Total disk size(902GB). This is what your data looks like on disk. so what that tell me is that your use case is not a pure GET but a mix of Reads and Updates.
The same thing is also happening in your memory where over time you’ll get alot of Memcached class size differences on updates(fragmentation).

If you look at doc fragmentation % over you a day or week or month … would would see it go up and down.

You currently are at 40% active memory percentage.
I’ve seen cluster with less 1% of active docs in memory with 0% of replicas in memory. Now that was a candidate for FULL EJECTION Bucket type.

80%(100GB) of system memory usage by memcached.bin = Data (55~GB) & META(15~GB) in memory @ 40% active ration is a not a bad thing because Memcached is managing its memory space via Value Ejection.

Example if you put double your data from (55~GB) to 100GB you memory would not got to 200GB, it might be about the same probably a little more, you would see you active working set be 5% or lower.

It was never clear how your application being effected by rebalance?

  1. Could the cluster never complete rebalance?
    Thus your cluster was not in a safe state of data being balanced in the cluster

2.Did your application see timeouts during rebalance?

ok, let me take you little bit back.
The cluster used to work for long time with 5 nodes of 122G. the resident was about 15% or even less. and my miss cache ratio was 0 (that’s means working set is actully very small compared to the 900G you talked about earlier). It was on the high water mark level of course. but application was just fine. (well… maybe response times gradually slowed but nothing serious.)
one day at October one of the nodes failed due to amazon problem (I think…) and than hell broke lose. I immediately added 2 nodes, but the rebalanced failed over and over because every time another node got into pend state becuase its Ram filled up. It happened few more times during the last month and finally I ended up with 12!! nodes and after I had to restart the nodes because even with 12 nodes some of them were almost in 100% ram usage and the application got errors from the cluster. after restarting them the cluster was OK - hence each node occupied keys+values+metadata. That’s how i expected the cluster to behave.
of course 12 nodes are unacceptable so i started to remove nodes (one by one) assuming the cluster is stable now. and than again after removing 2 of the nodes I saw the fast growth of the Ram and stopped were I am now.The application was ok during the first rebalance, but in the second one when ram got to about 100G it started to return empty results and failed to set data or unable to locate node, then again we had to downtime our application.

summarizing things - it is very weird that the cluster behaves well and as expected during normal times, but on stress it must hold at least 5 times of ram than the application actually needs that’s what bothering me the most.

@gelibter,

Its would be hard to diagnosis certain failure that happen weeks ago as the Couchbase Logs have rotated over them.

Maybe , but they might have been so low they averaged less the 1 percent.
If you look at the SUMMARY page there are some Cache Miss. You see them in the “Disk Reads per second”. and you can see them in the “bg wait time” stats as CB process takes time to pull data from Disk.

To get a more accurate view on performance on GET/SET …etc and any disk operations you can use
cbstats timings. Hope fully it should all be in microseconds and some milliseconds.

#opt/couchbase/bin/cbstats localhost:11210 timings -b {bucket_name} -p {bucket_password}

https://developer.couchbase.com/documentation/server/current/cli/cbstats/cbstats-timing.html

if you put in localhost:11210 you will get stats of the localhost.
if you put in localhost:11211 it will get Moxie to pull stats from the whole cluster.

get_cmd = GET()s
store_cmd or cmd_store = SET()s.

You can sorta make out the commands via the GUI.

SWAPPINESS
In your case I’m worried about your swap usage. It should be close to zero
https://www.cyberciti.biz/faq/linux-which-process-is-using-swap/
Could you double check if any of Couchbase’s process are using it
and if so if its being release over time.

This was very very low about 4-5 read per second no more than that

Swap is used by couchbase.
it was always on 0. after the first failure it begun to fill up even though it was on 0.
after i restarted the nodes. it returned back to 60. and I manually set it back to 0. now it slowly goes down.

Not sure 100% of timeline and cluster size during the timeline , but sounds like after a node fail over the node(s) and it didn’t have alot of capacity so it went to swap but know you have lot of capacity so swap was only used on the nodes that were rebooted with the swappiness = 60(Default).

COST
:ok_hand: It sounds like your in a good spot right now , my first suggesting of XDCR to another cluster I don’t think you need. If cost is an issue you might want to go down a few nodes = less active docs in memory though.
or
If your ok with the 42% active ration and want less machine , I would still suggest you increase your bucket allocation from 72GB to something less then 100GB and remove a node or two.

REPRODUCE ISSUE
But you do want to figure out the timeout and performance issue from a few months ago. So in a lower environment set up a 3 nodes cluster with XYZ % of data in production and test failure scenario when couchbase nodes go down.
Is the SDK not getting an updated cluster map even after auto-failover?
Is my out autofailover set to high and the timeout on my SDK set to low?

@drigby

Thank you very much for you details responses.
I adopt your Idea and will try to reproduce the issues.

Having said that, I’m not convinced that 62G data and 15G metadata requires 100G of ram and especially over usage of the cluster quota.
i’d expected the cluster to use exactly what was allocate to it, if i hit the water mark than ejections occurs. the 50G should be used to handle rebalances and stress times. that’s how i see it.
my hunch is that something isn’t working well in terms of memory management during the rebalance which causes over usage of cluster quota. currently i’m sure that my cluster as is cannot rebalance without affecting the application, (just because i learned the hard way that when the cluster is over used its quota - that’s a fact) therefore I think I’ll do XDCR and will update here how the cluster continue to behave, I’m sure others will be interested in that too :slight_smile:

1 Like

So, I did XDCR, this is the “before” cluster with 10 nodes, it also had 150G in metadata and 550G of data in ram, cluster size is about 900G, 0 cache miss ratio 0 reads from disk


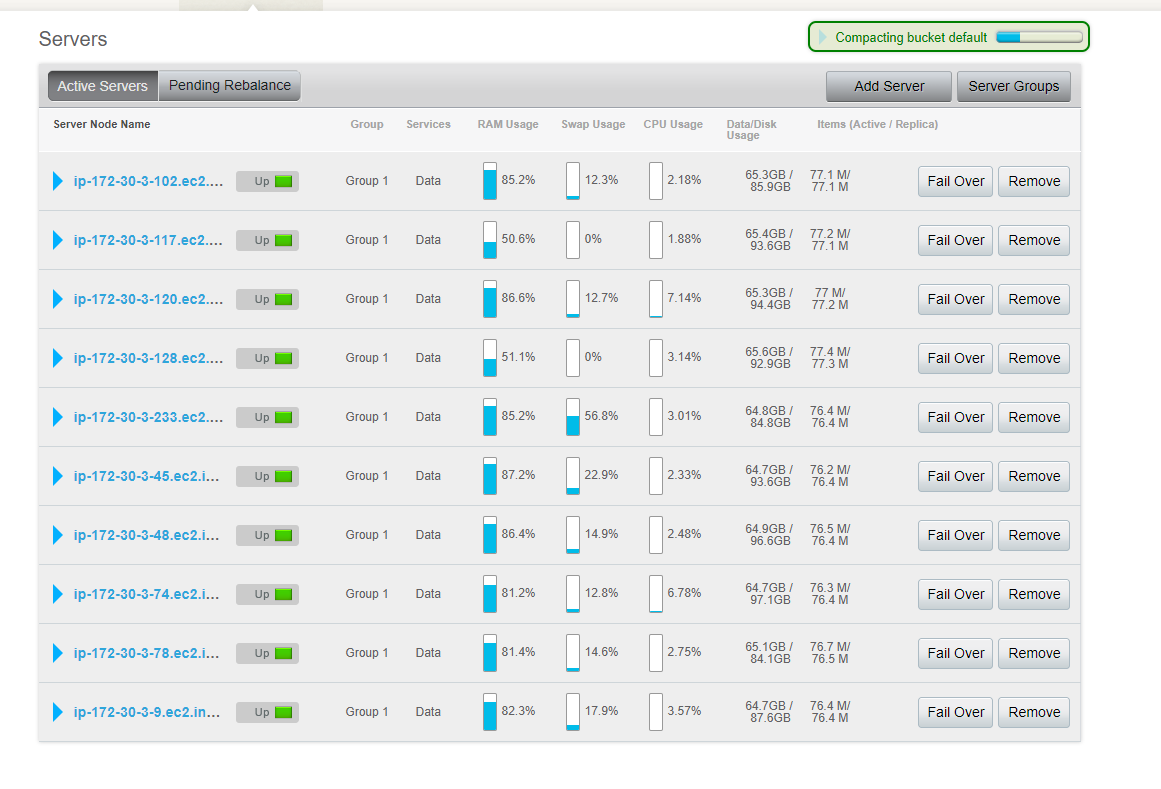
this is the “after” 150G metadata 450G in data ram, cluster size is the same, 0 cache miss rarion 0 reads from disk,
the ram didn’t exceed the 70G that it was allocated during the XDCR as expected, now this is an healty cluster I hope and expected next time i rebalance it the ram will not be affect and allow smooth process.