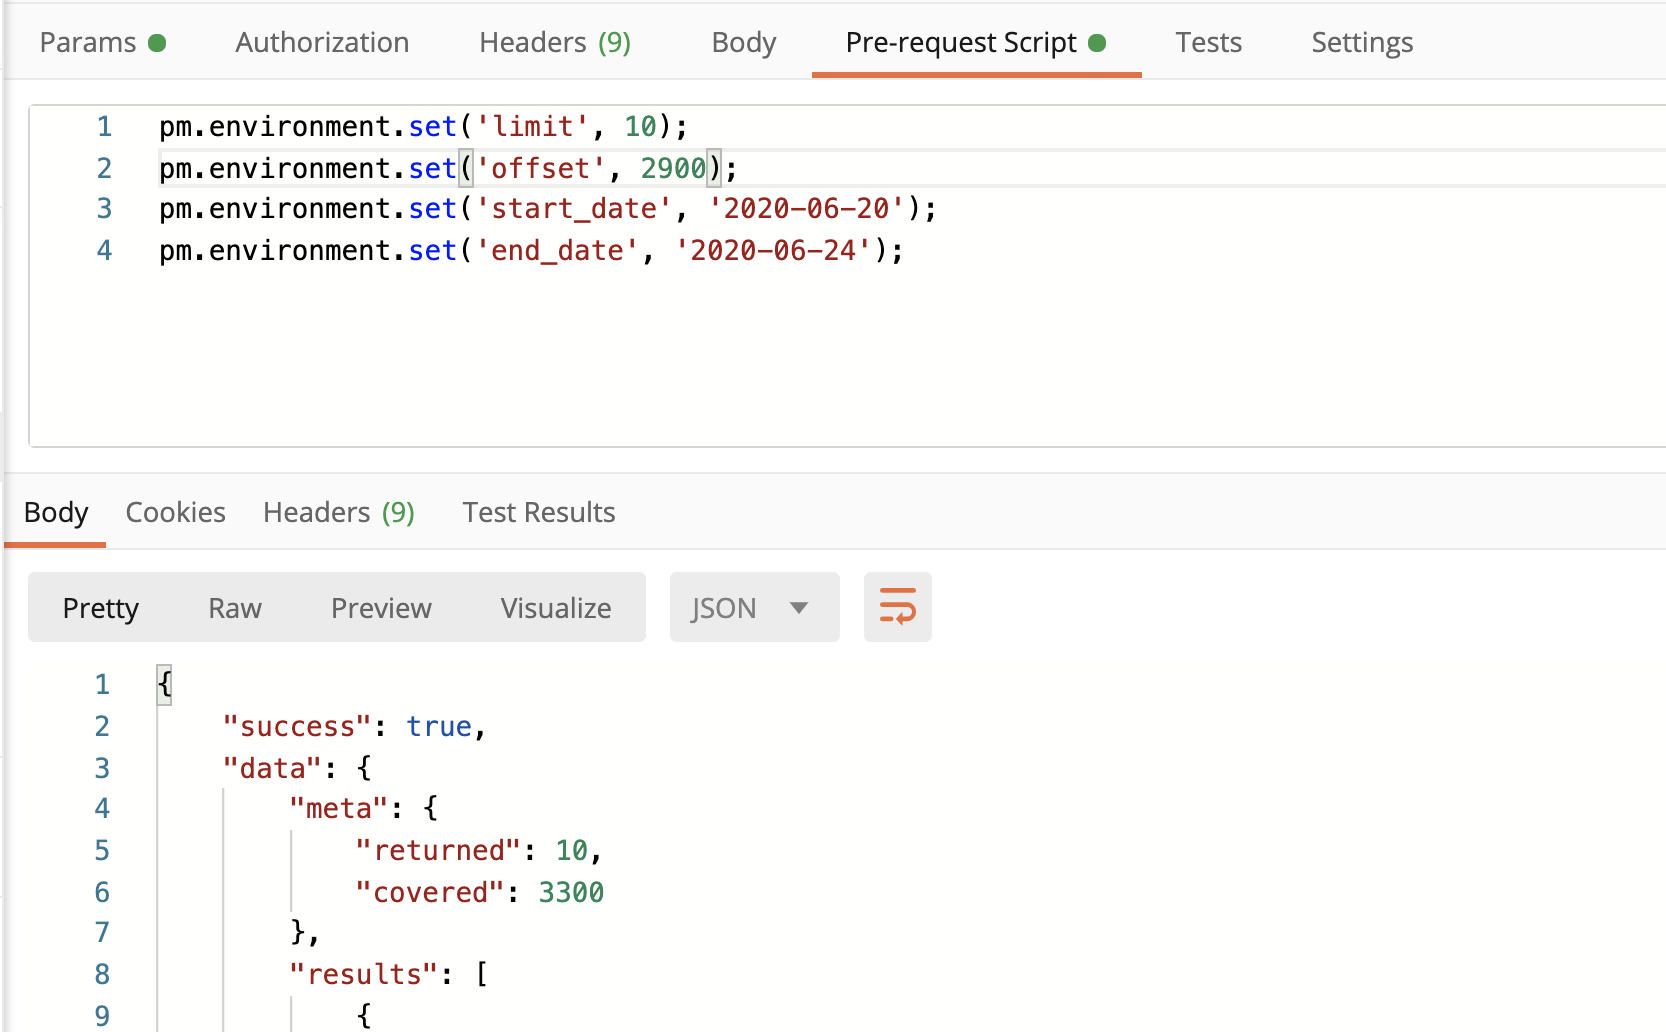
Thank you for your assistance. Below is the redacted response I receive from the same FTS Query via the REST API:
I should also point there are 3 nodes in our cluster.
{
  "status": {
    "total": 12,
    "failed": 4,
    "successful": 8,
    "errors": {
      "screened_name_request_test_3f33ca20613e41ce_13aa53f3": "remote: query got status code: 429, queryURL: https://ec2-35-174-184-155.compute-1.amazonaws.com:18094/api/index/screened_name_request_test/query, buf: {\"ctl\":{\"timeout\":0,\"consistency\":null},\"pindexNames\":[\"screened_name_request_test_3f33ca20613e41ce_13aa53f3\",\"screened_name_request_test_3f33ca20613e41ce_aa574717\"],\"query\":{\"must\":{\"conjuncts\":[{\"start\":\"2020-06-20T00:00:00-04:00\",\"end\":\"2020-06-24T23:59:59-04:00\",\"inclusive_start\":true,\"inclusive_end\":true,\"field\":\"completed\"},{\"regexp\":\"aircomm::dp::screened::(name|address)::request::[0-9]{4,10}\",\"field\":\"_id\"}]}},\"size\":2910,\"from\":0,\"highlight\":null,\"fields\":[\"*\"],\"facets\":null,\"explain\":false,\"sort\":[\"-_score\"],\"includeLocations\":false}, resp: &http.Response{Status:\"429 Too Many Requests\", StatusCode:429, Proto:\"HTTP/1.1\", ProtoMajor:1, ProtoMinor:1, Header:http.Header{\"Date\":[]string{\"Thu, 25 Jun 2020 11:28:21 GMT\"}, \"Content-Length\":[]string{\"674\"}, \"Content-Type\":[]string{\"application/json\"}, \"X-Content-Type-Options\":[]string{\"nosniff\"}}, Body:(*http.bodyEOFSignal)(0xc4269e3d40), ContentLength:674, TransferEncoding:[]string(nil), Close:false, Uncompressed:false, Trailer:http.Header(nil), Request:(*http.Request)(0xc421508c00), TLS:(*tls.ConnectionState)(0xc4274018c0)}, err: <nil>",
      "screened_name_request_test_3f33ca20613e41ce_18572d87": "remote: query got status code: 429, queryURL: https://ec2-18-207-241-164.compute-1.amazonaws.com:18094/api/index/screened_name_request_test/query, buf: {\"ctl\":{\"timeout\":0,\"consistency\":null},\"pindexNames\":[\"screened_name_request_test_3f33ca20613e41ce_18572d87\",\"screened_name_request_test_3f33ca20613e41ce_6ddbfb54\"],\"query\":{\"must\":{\"conjuncts\":[{\"start\":\"2020-06-20T00:00:00-04:00\",\"end\":\"2020-06-24T23:59:59-04:00\",\"inclusive_start\":true,\"inclusive_end\":true,\"field\":\"completed\"},{\"regexp\":\"aircomm::dp::screened::(name|address)::request::[0-9]{4,10}\",\"field\":\"_id\"}]}},\"size\":2910,\"from\":0,\"highlight\":null,\"fields\":[\"*\"],\"facets\":null,\"explain\":false,\"sort\":[\"-_score\"],\"includeLocations\":false}, resp: &http.Response{Status:\"429 Too Many Requests\", StatusCode:429, Proto:\"HTTP/1.1\", ProtoMajor:1, ProtoMinor:1, Header:http.Header{\"Content-Type\":[]string{\"application/json\"}, \"X-Content-Type-Options\":[]string{\"nosniff\"}, \"Date\":[]string{\"Thu, 25 Jun 2020 11:28:21 GMT\"}, \"Content-Length\":[]string{\"674\"}}, Body:(*http.bodyEOFSignal)(0xc4269e3c80), ContentLength:674, TransferEncoding:[]string(nil), Close:false, Uncompressed:false, Trailer:http.Header(nil), Request:(*http.Request)(0xc4204b4700), TLS:(*tls.ConnectionState)(0xc42bb3c630)}, err: <nil>",
      "screened_name_request_test_3f33ca20613e41ce_6ddbfb54": "remote: query got status code: 429, queryURL: https://ec2-18-207-241-164.compute-1.amazonaws.com:18094/api/index/screened_name_request_test/query, buf: {\"ctl\":{\"timeout\":0,\"consistency\":null},\"pindexNames\":[\"screened_name_request_test_3f33ca20613e41ce_18572d87\",\"screened_name_request_test_3f33ca20613e41ce_6ddbfb54\"],\"query\":{\"must\":{\"conjuncts\":[{\"start\":\"2020-06-20T00:00:00-04:00\",\"end\":\"2020-06-24T23:59:59-04:00\",\"inclusive_start\":true,\"inclusive_end\":true,\"field\":\"completed\"},{\"regexp\":\"aircomm::dp::screened::(name|address)::request::[0-9]{4,10}\",\"field\":\"_id\"}]}},\"size\":2910,\"from\":0,\"highlight\":null,\"fields\":[\"*\"],\"facets\":null,\"explain\":false,\"sort\":[\"-_score\"],\"includeLocations\":false}, resp: &http.Response{Status:\"429 Too Many Requests\", StatusCode:429, Proto:\"HTTP/1.1\", ProtoMajor:1, ProtoMinor:1, Header:http.Header{\"Content-Type\":[]string{\"application/json\"}, \"X-Content-Type-Options\":[]string{\"nosniff\"}, \"Date\":[]string{\"Thu, 25 Jun 2020 11:28:21 GMT\"}, \"Content-Length\":[]string{\"674\"}}, Body:(*http.bodyEOFSignal)(0xc4269e3c80), ContentLength:674, TransferEncoding:[]string(nil), Close:false, Uncompressed:false, Trailer:http.Header(nil), Request:(*http.Request)(0xc4204b4700), TLS:(*tls.ConnectionState)(0xc42bb3c630)}, err: <nil>",
      "screened_name_request_test_3f33ca20613e41ce_aa574717": "remote: query got status code: 429, queryURL: https://ec2-35-174-184-155.compute-1.amazonaws.com:18094/api/index/screened_name_request_test/query, buf: {\"ctl\":{\"timeout\":0,\"consistency\":null},\"pindexNames\":[\"screened_name_request_test_3f33ca20613e41ce_13aa53f3\",\"screened_name_request_test_3f33ca20613e41ce_aa574717\"],\"query\":{\"must\":{\"conjuncts\":[{\"start\":\"2020-06-20T00:00:00-04:00\",\"end\":\"2020-06-24T23:59:59-04:00\",\"inclusive_start\":true,\"inclusive_end\":true,\"field\":\"completed\"},{\"regexp\":\"aircomm::dp::screened::(name|address)::request::[0-9]{4,10}\",\"field\":\"_id\"}]}},\"size\":2910,\"from\":0,\"highlight\":null,\"fields\":[\"*\"],\"facets\":null,\"explain\":false,\"sort\":[\"-_score\"],\"includeLocations\":false}, resp: &http.Response{Status:\"429 Too Many Requests\", StatusCode:429, Proto:\"HTTP/1.1\", ProtoMajor:1, ProtoMinor:1, Header:http.Header{\"Date\":[]string{\"Thu, 25 Jun 2020 11:28:21 GMT\"}, \"Content-Length\":[]string{\"674\"}, \"Content-Type\":[]string{\"application/json\"}, \"X-Content-Type-Options\":[]string{\"nosniff\"}}, Body:(*http.bodyEOFSignal)(0xc4269e3d40), ContentLength:674, TransferEncoding:[]string(nil), Close:false, Uncompressed:false, Trailer:http.Header(nil), Request:(*http.Request)(0xc421508c00), TLS:(*tls.ConnectionState)(0xc4274018c0)}, err: <nil>"
    }
  },
  "request": {
    "query": {
      "must": {
        "conjuncts": [{
            "start": "2020-06-20T00:00:00-04:00",
            "end": "2020-06-24T23:59:59-04:00",
            "inclusive_start": true,
            "inclusive_end": true,
            "field": "completed"
          },
          {
            "regexp": "xxxx::dp::screened::(name|address)::request::[0-9]{4,10}",
            "field": "_id"
          }
        ]
      }
    },
    "size": 10,
    "from": 2900,
    "highlight": null,
    "fields": [
      "*"
    ],
    "facets": null,
    "explain": false,
    "sort": [
      "-_score"
    ],
    "includeLocations": false
  },
  "hits": [],
  "total_hits": 1655,
  "max_score": 0.08077975277185859,
  "took": 29724104,
  "facets": null
}