I have a long initial sync of a CBL to a Gateway, it takes some 26 minutes to obtain 880K docs in a single bucket. There seems to be a half life in play. As the sync continues the jank builds; threads seem to get overloaded as the app gets less and less responsive. Fortunately the sync does run to completion; when the sync is complete the app becomes snappy again.
As I mentioned in an earlier post, the initial sync in my application will occur anytime someone re-purposes a handheld from one store to another. (stop replication, delete data off the handheld, re-initialize for the new store) Hopefully, this will be a relatively rare event. However, it will happen, so…
Q: is there some way to defeat the jank by breaking the initial sync into N smaller requests?
Hmm. If i interrupt the sync and start it again, I would have thought it would have been snappy once again. But it seems to be slow from the get-go until the full sync is complete. I’m not sure why that would be the case. All I am doing is using the UI to retrieve data from the couchbase server.
To provide a little context… The initial sync of a large dataset is unavoidable. In order to mitigate the adverse effects of that initial sync, I was planning to monitor the sync itself and until the sync is complete, just call the query against the Couchbase server for answers. So while the initial sync is on-going queries will take some 100 to 200 ms (because of the remote hop). And after the sync is complete, the handheld can work totally offline and queries will return in about 5 ms.
At least that was the plan. And it was working for the first 12 minutes of the sync, or so. Then the UI thread became unresponsive. And as I said, halting the App and restarting it did not unburden the UI thread.
What CBL platform and OS is this?
Have you monitored the process’s memory usage, or done any CPU profiling?
Hmm. If i interrupt the sync and start it again, I would have thought it would have been snappy once again. But it seems to be slow from the get-go until the full sync is complete.
That implies the slowdown is due to something that persists between replications. Memory leaks are a possibility. It’s also possible that your code is running something in response to database changes which takes O(n) time, like an unindexed query. As the database grows and the query repeats, this adds up to O(n^2).
Why would a CBL sync bog down the UI threads?
Again, profiling would partly answer this — most likely it’s caused either by database contention between the UI and the replicator, or by high GC activity due to excessive allocations (assuming you’re not using Obj-C or Swift.)
Database contention is usually seen with writes, because the underlying SQLite database only allows one writer at a time, but it can show up with reads too if the underlying storage can’t keep up with the amount of I/O.
Using Acouchbase-lite-android:2.6.0, on . Android PIE. App development is in Java.
I’m new to Android development, so I haven’t tackled profiling just yet. Give me a day or two to figure things out and make all the noob mistakes.
When the initial sync is running there is no Index and I am not using the local CBL. Just get a text field from the user and calling the REST api on the Couchbase server and showing results in an EditText field. I am listening to Replication changes and putting text in an EditText field. The later only updates the UI at most once a second.
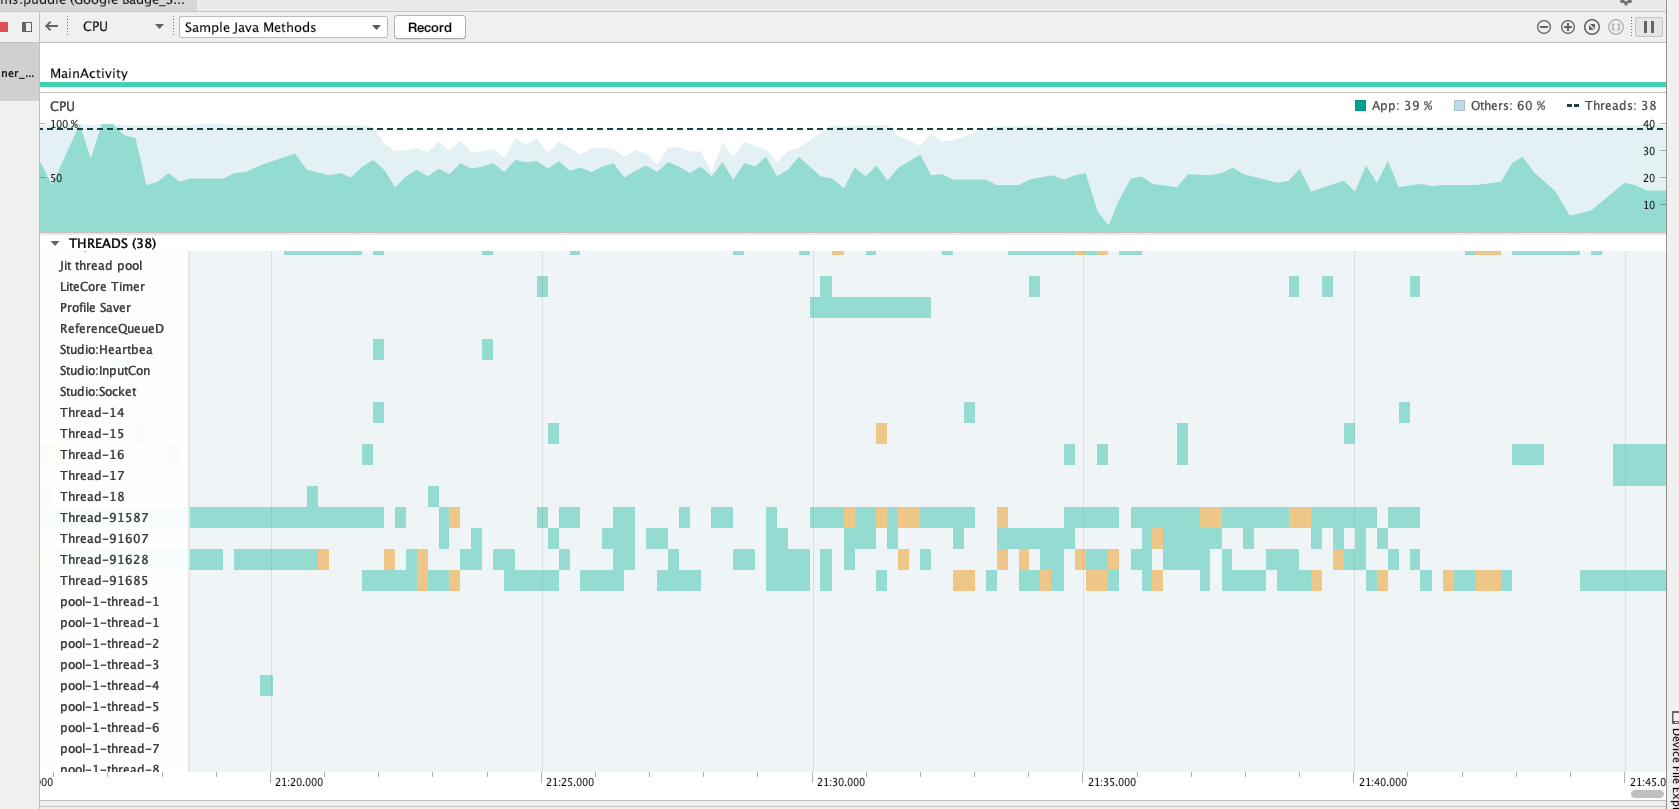
My app is native Java. I tried profiling and there seem to be a few threads that dominate, but I have no idea why they have anything to do with the UI thread. The other profiler channels seem uninteresting. The CPU looks like the following:
If you see jank, you are, almost certainly, doing things on the UI thread that should not be done there. You should not do any I/O (reading or writing the DB), and you should not be waiting for replications. I have never seen replication max out the CPU on a recent Android device, in a way that slows down the UI.
I don’t see the Jank until the sync has transferred some 500K documents. And once again, if I kill the app and restart it the sync continues (as designed) but the Jank is there as well.
Yeah I just found the replicator.addChangeListener method that lets you specify a ThreadPoolExecutor so that it won’t end up on the UI thread. This solves most of my problems with Jank. I still can’t make remote calls to the couchbase server while it is syncing, as I think the I/O is maxed out servicing the sync.
The UI thread appearing Janky on long initial sync is actually a feature of Android as of Marshmallow, intended to save the battery. I do not believe it was effecting Replication performance, but the UI would slow down because of “doze” mode.
That is interesting but I don’t think it is correct. Are you talking about your app being in the foreground and active but the performance is degraded, i.e. you see dropped frames in your app, because of doze mode? Can you share official documentation for this please?
The following table outlines the current restrictions. These restrictions do not apply while the device is charging.
Can you test this again with doze mode on and with the device charging. Is the jankiness the same as with doze mode off? Do you test this on a physical device?
It has only been tested using the Android Emulator. For whatever it is worth, the laptop was plugged in.
All testing on a physical device thus far has been unsuccessful. The App is built against Android Pie and as such it has issues connecting to an unsecured gateway. (I’ve tried both to back off to a previous version of Android which has compilation issues, and configuring the android manifest and security XML files, without luck).
We will try to secure the gateway. It seems the only path forward.
I have tried to connect via ws:// using cleartextTraficPermitted=“true” using the manifest and network_security_config.xml as you suggested. But I still get a 502 “Bad Gateway” error.
W/CouchbaseLite/NETWORK: WebSocketListener.onFailure() response -> Response{protocol=http/1.0, code=502, message=Bad Gateway, url=http:// … :4984/common/_blipsync}: java.net.ProtocolException: Expected HTTP 101 response but was ‘502 Bad Gateway’