Most users started to use the lastest app version with the CBL 2.6 today. Before it was CBL 1.4. I’m unsure what is happening at the moment. Continuous sync stopped working. One-time pull sync works fine. Restarting the SG service on both machines allows continuous sync to start again. I’ll add another machine with SG service and keep an eye on this issue.
The primary feature released in Sync Gateway 2.6 was channel cache enhancements.
I can’t answer your question easily without understanding your usage of channels, as well as your configuration.
Thank you for the links. I read through the documentation. The channel and revision cache is for EE versions only. That is fine. I think it has nothing to do with SG 2.6. I was running this version for some time already. The only change in the last days is that an Android app update rolled out with CBL 2.6 - previously it was CBL 1.4.
Now I have 3 SG nodes and each uses between 500MB and 1000MB. So there’s plenty of RAM unallocated. Sync works. It has been all good now for the last ~3 hours.
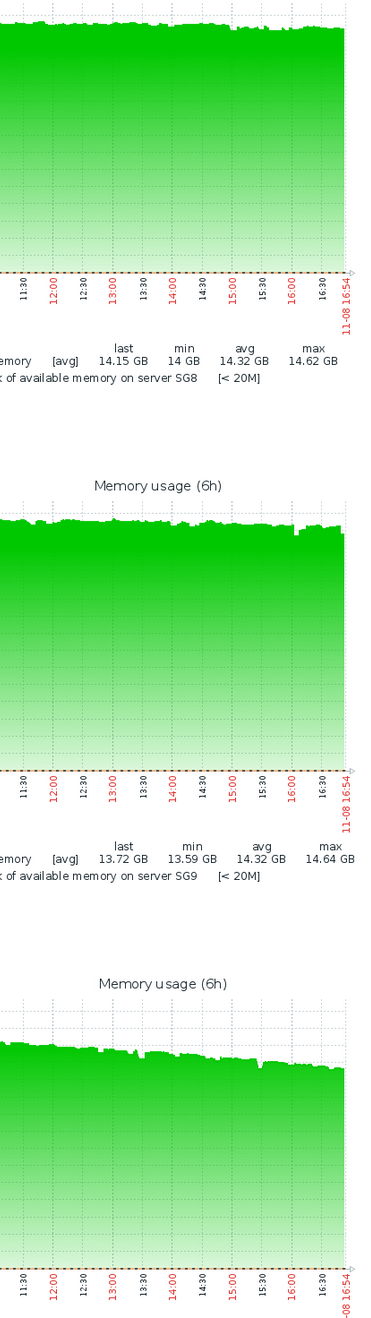
I’d like to follow up and report that Thursday (following day) and Friday all looked good. Here’s 6 hours from Friday. Click on the picture to see all 3 SG nodes and their RAM usage.
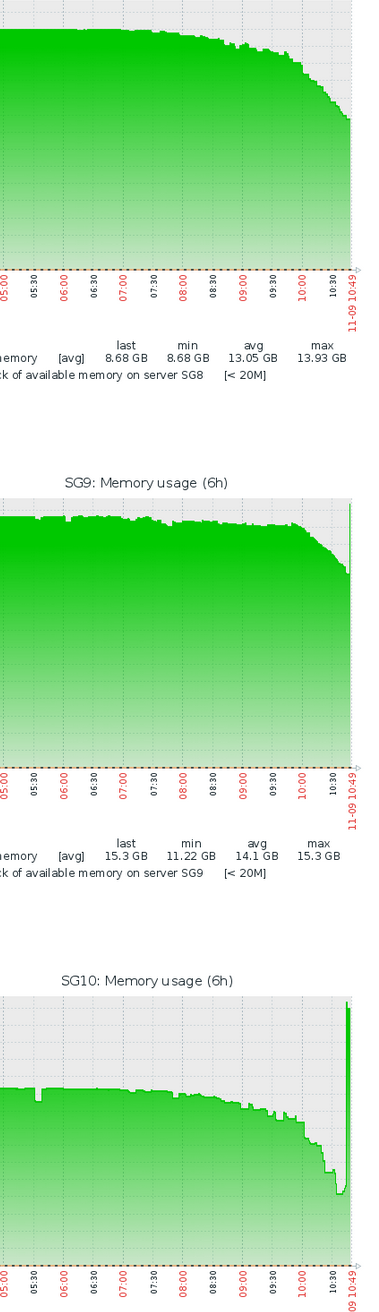
Saturday morning was different. All SG services rapidly allocated RAM and syncing between clients did not work. I needed to restart all 3 SG nodes. Here’s a screenshot, again click on the picture to see all 3 nodes.
This is very strange behaviour that I’d like to get to the bottom of, given it was stable for a couple of days, but then suddenly ate up a bunch of memory. Maybe a client is doing something weird which is causing SG to leak memory somehow…
If possible, next time this happens - before restarting each node, can you grab a couple of profiles from each node using these URLs:
heap: gzip compressed data, max speed
goroutine: gzip compressed data, max speed
And then gunzip failed:
gzip: heap: unknown suffix -- ignored
Moving heap to heap.gz and then running gunzip does work but the source is still unreadable. Once this occurs again can I attach these files here? Or did I download them incorrectly?
(Also the issue occured again but I didn’t get the files at that time.)
In just the last couple of minutes the sync stopped working again. With that I mean that the CBL replicator status shows “BUSY” on all connected clients. Web-App features like signing up new users, etc, fails using the SG REST API.
Current setup: only 1 SG node. Backstory: I had two SG nodes incase one fails. After the BUSY issues appeared I added a third SG node. As this didn’t help I scaled down to a single SG node.
Here are the files. I had to zip them as this forum only allows certain file types to be uploaded. The files were not compressed, just saved.
Screenshot of RAM usage for the last 6 hours. CPU and network resources are mostly unused. The last spike in the RAM graph is when I restarted the SG service.
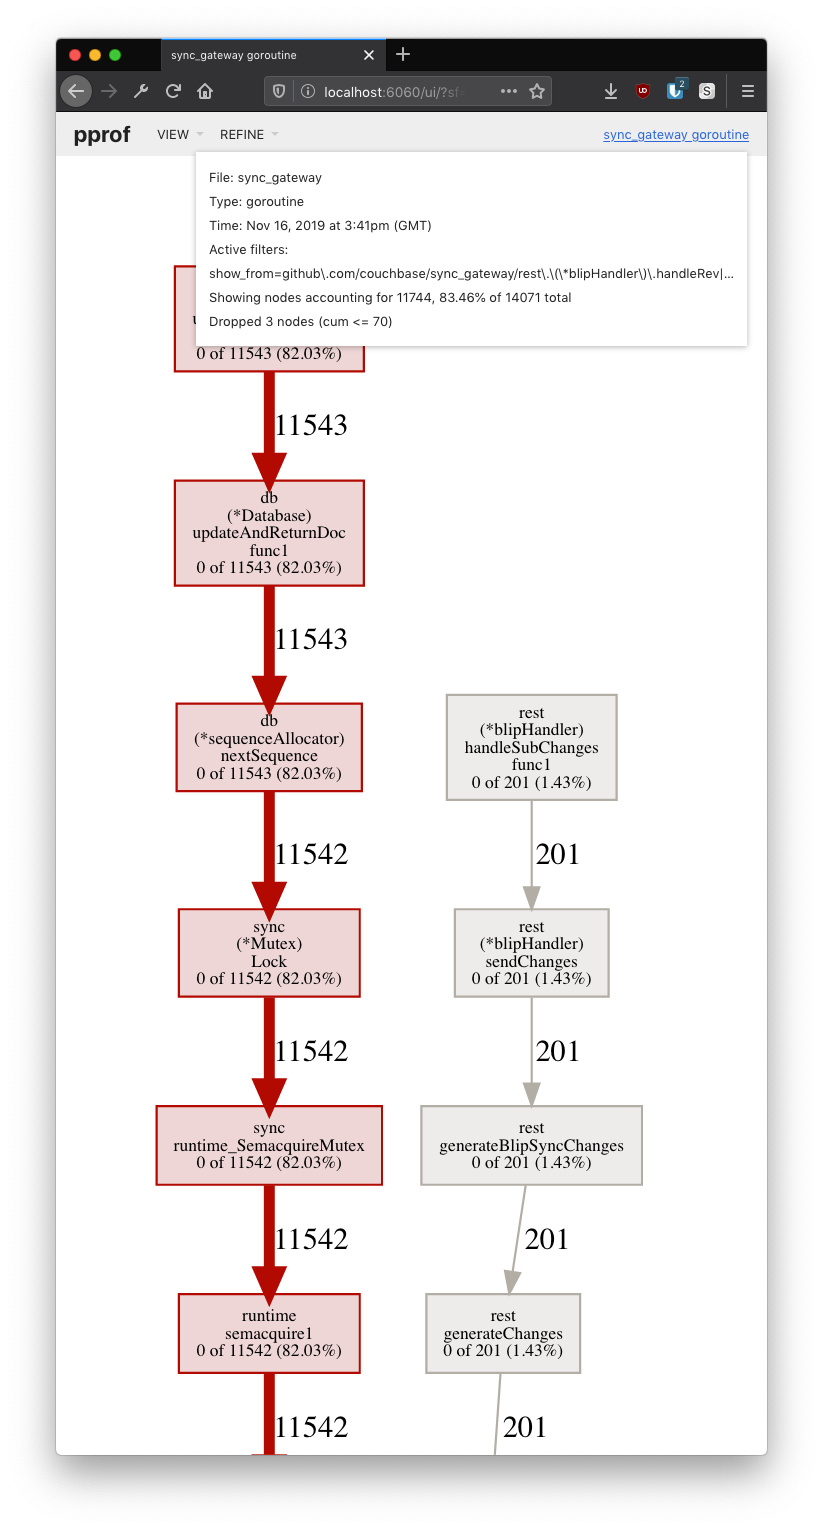
Based on the goroutine profile, I see around 200 clients connected, but nearly 12,000 revisions stuck waiting to get a sequence number to be written to the database.
This seems like it might be a client trying to push something, timing out, reconnecting and retrying, pushing more and more stuff into the queue. We fixed an issue that may be causing this in an upcoming version of Sync Gateway (https://github.com/couchbase/sync_gateway/pull/4222). We expect this release to ship early 2020.
I’d expect adding more SG nodes to help this situation. Did you see exactly the same behaviour? Or just more spread out over the nodes. I presume you’re routing traffic to SG thorugh a load balancer so you can distribute requests from clients?
Interesting find! I tried to render the two files (heap and goroutine) myself by using GitHub - gperftools/gperftools: Main gperftools repository. But I failed. Could you please share the command I’d need to execute? Will I be able to find the user id of the user who pushes all those revisions?
At the time when I had 3 SG nodes (currently I have 1 SG node) the BUSY issue appeared, too. There was a big BUT though! I had observed this issue with several clients connected to the cluster (with a loadbalancer, you are correct!). Some clients (group A) were able to update documents and push them up. Other clients (group B) could update documents locally but the changes were not pushed up. The sync status with those devices was stuck at BUSY. But these clients (group B) received document updates from group A and displayed them. With that I mean that most likely one SG node had the issue you are describing in your last post but other SG nodes had not. This makes it more difficult to figure out which SG service to restart. And only restarting solves the issue.
At the momemt I’m coding a makeshift app which periodically updates a specific document, waits a few seconds, checks the replicator status and if it is still in the BUSY state the SG service is restarted via ssh’ing into the SG node.
Tagging @humpback_whale and @fatmonkey45: Could it be that you face a similiar issue where many, many revisions got stuck and this results in the BUSY state. See the previous post please.
You can use the Sync Gateway logs to identify which client is doing what, by looking at the username, and the context IDs.
In this example, it shows a device pulling documents from SG. You can see username demo and the context ID [5b31e98] corresponding to that replication:
I was able to create the Go call stack back in November and also went through the logs but this didn’t help finding the issue. When the service hangs and needs to be restarted I save goroutine and heap files. There were more than 100 automatic restarts and I have all the files saved if they are needed.
I was contacted by a user who has a bigger dataset (I believe it was about 1000 documents*). I also was unable to one-push replicate the dataset to my production cluster. It did work when pushing it to my dev cluster which is a lot less powerful but only used by me. The production cluster is also very much overprovisioned. All resources rather idle on all nodes.
I think my best option is to wait for the next SG release.
*Documents in my data model are small. Say on average about 5 fields, rarely more than 1 level deep (nesting). Average character count maybe around 200.
I installed SG version 2.7 (Couchbase Sync Gateway/2.7.0(166;a52b9c4) CE) and was now able to push the quoted dataset. That’s great! This might be an indicator that the issue is solved.
I still have a service running which checks if the SG service stops working properly. I’ll update once my service doesn’t detect this behaviour anymore.
Apologies for the length of time this issue has persisted for. I believe your particular situation was down to a combination of issues fixed in 2.7.0, the main one being a deadlock in the sequence allocator that is only triggered under certain load.
Please do let us know if you run into any other issues with 2.7.0