before the Indexerthread change partition by hash for meta().id was taking ~40 mins also .
Yes indexer CPU % is around >3700 % after thread change.
Since my index is not MOI and SGI based why memory throttle matters here . IndexmemoryQuota per index node is 50 GB . Isn’t it sufficient for index on 180 M ?
Also I see first 50% of Index creation time is FAST than rest 50% . Is that becaise of DATP blocking ? what is DATP and how to free that channels ??
before the Indexerthread change partition by hash for meta().id was taking ~40 mins also .
This is unexpected. I was expecting that there will be a improvement in index build times with partition by hash(meta().id) vs partition by hash(11 fields). What is the number of partitions you have specified when building index with partition by hash(meta().id). If you have not specified any, can you build the index with 3 partitions (as you have specified for the index before).
Yes indexer CPU % is around >3700 % after thread change.
With 1024 threads, we are only utilising 37 cores of CPU while the node has up to 48 cores. So, there is CPU available but indexer is not able to make full use of it because it is being bottlenecked in the pipeline.
Since my index is not MOI and SGI based why memory throttle matters here .
Because, the index first goes to memory and then to disk. Also, mem_throttled is a transient phenomenon. What is the resident_percent of the index? Is it maintained at 100%?
IndexmemoryQuota per index node is 50 GB . Isn’t it sufficient for index on 180 M ?
How many indexes do you have on the bucket at the time of index build?
index cache resident percent always stay 100% during build .
I have only one indexes on that bucket .
I will share the time with 3 partitions by hash . you want me run this with indexethread : 1024 ?
I will share the time with 3 partitions by hash . you want me run this with indexethread : 1024 ?
No. I am looking at the default value. Also, can you share the cbcollect logs on the support ticket you created after building this index? I want to understand why the storage is mem_throttled if there is only one index when building with 1024 threads.
I have another cluster where I rebuild indexer node with memory optimized parameters and the index creation is super slow there as well … it is 16 minutes so far 91% complete . I was expecting atleast memory index would be super fast . just trying out .
just so you know I am working on 2 different cluster on my platform with MDS and non-MDS . I guess the log I have uploaded in NON-mDS platform . Since the log I have upload I changed lot of things .
Btw our network team reported that Network IO across 3 nodes on non-MDS cluster has been seen as 7-9 MB / s while Index rebuilding is going on … you need this IO or storage IO ?
the index definition below :
CREATE INDEX TEST ON ALL_RATES(SOURCE_CODE,GUESTS,LOS,K_PROPERTY,ROOM_PRODUCT_DESCRIPTION,ARRIVAL_DATE,VALID_FROM_DTTM,VALID_TO_DTTM,LAST_SHOP_DTTM,RATE,PROPERTY_NAME,SHOP_STATUS,LINE_STATUS) PARTITION BY hash((meta().id)) WITH { “num_partition”:8 }
and on non-mDS box so far its 54% completed since last 14 minutes with Network IO 7-9 MB/s
also at the time this index is building the Storage IO across K8s 3 nodes cluster PVC’s is : 140 MB/S bandwidth with IOPS ~20 K average .
I am uploading this screenshot for your reference for the K8s PVC’s we have and we don’t have any other stuff running on this PVC’s except Couchbase on dedicated namespaces.

I am uploading the cbcollect as soon as this TEST index creation is done .
As of now Index 88% complete in last 28 minutes .
Also I have noticed projector process dominated >1000% CPU and most of the time on top of Indexer CPU usage … what is that for ?
I have another cluster where I rebuild indexer node with memory optimized parameters and the index creation is super slow there as well … it is 16 minutes so far 91% complete . I was expecting atleast memory index would be super fast . just trying out .
Can you share the logs for this cluster? The problem with a single node having all services is that the individual services might be contending for CPU/memory. I need to look at logs to confirm this.
Btw our network team reported that Network IO across 3 nodes on non-MDS cluster has been seen as 7-9 MB / s while Index rebuilding is going on … you need this IO or storage IO ?
The network IO bandwidth is very less. Since you have 184M docs,if the avg_key_size is ~100 bytes, the amount of data you are transmitting over network for the non-partitioned index is 184M*100/1024 = ~18G. With 9MB/sec rate, this would take roughly 34 Min. With paritioned index as you will be transmitting more data, the index build will be slow. I can see that network is clearly a limiting factor here. You should increase the network bandwith between the nodes to improve the index build performance.
Also I have noticed projector process dominated >1000% CPU and most of the time on top of Indexer CPU usage … what is that for ?
Projector process processes the incoming doc, filters it for the index definition and returns only the values that are of interest to the index. Since it does a lot of processing, it is expected to take more CPU. In this case, indexer is consuming less CPU because network is a bottlneck. Otherwise, indexer process is also CPU intensive i.e. it tries to utilise as much CPU as possible
Also, what is the peak network bandwidth of the node? Is it 10MB/sec? BTW, MDS refers to the cluster config where individual services run on different nodes (https://docs.couchbase.com/server/current/clustersetup/services-mds.html). The logs you have uploaded are for MDS setup
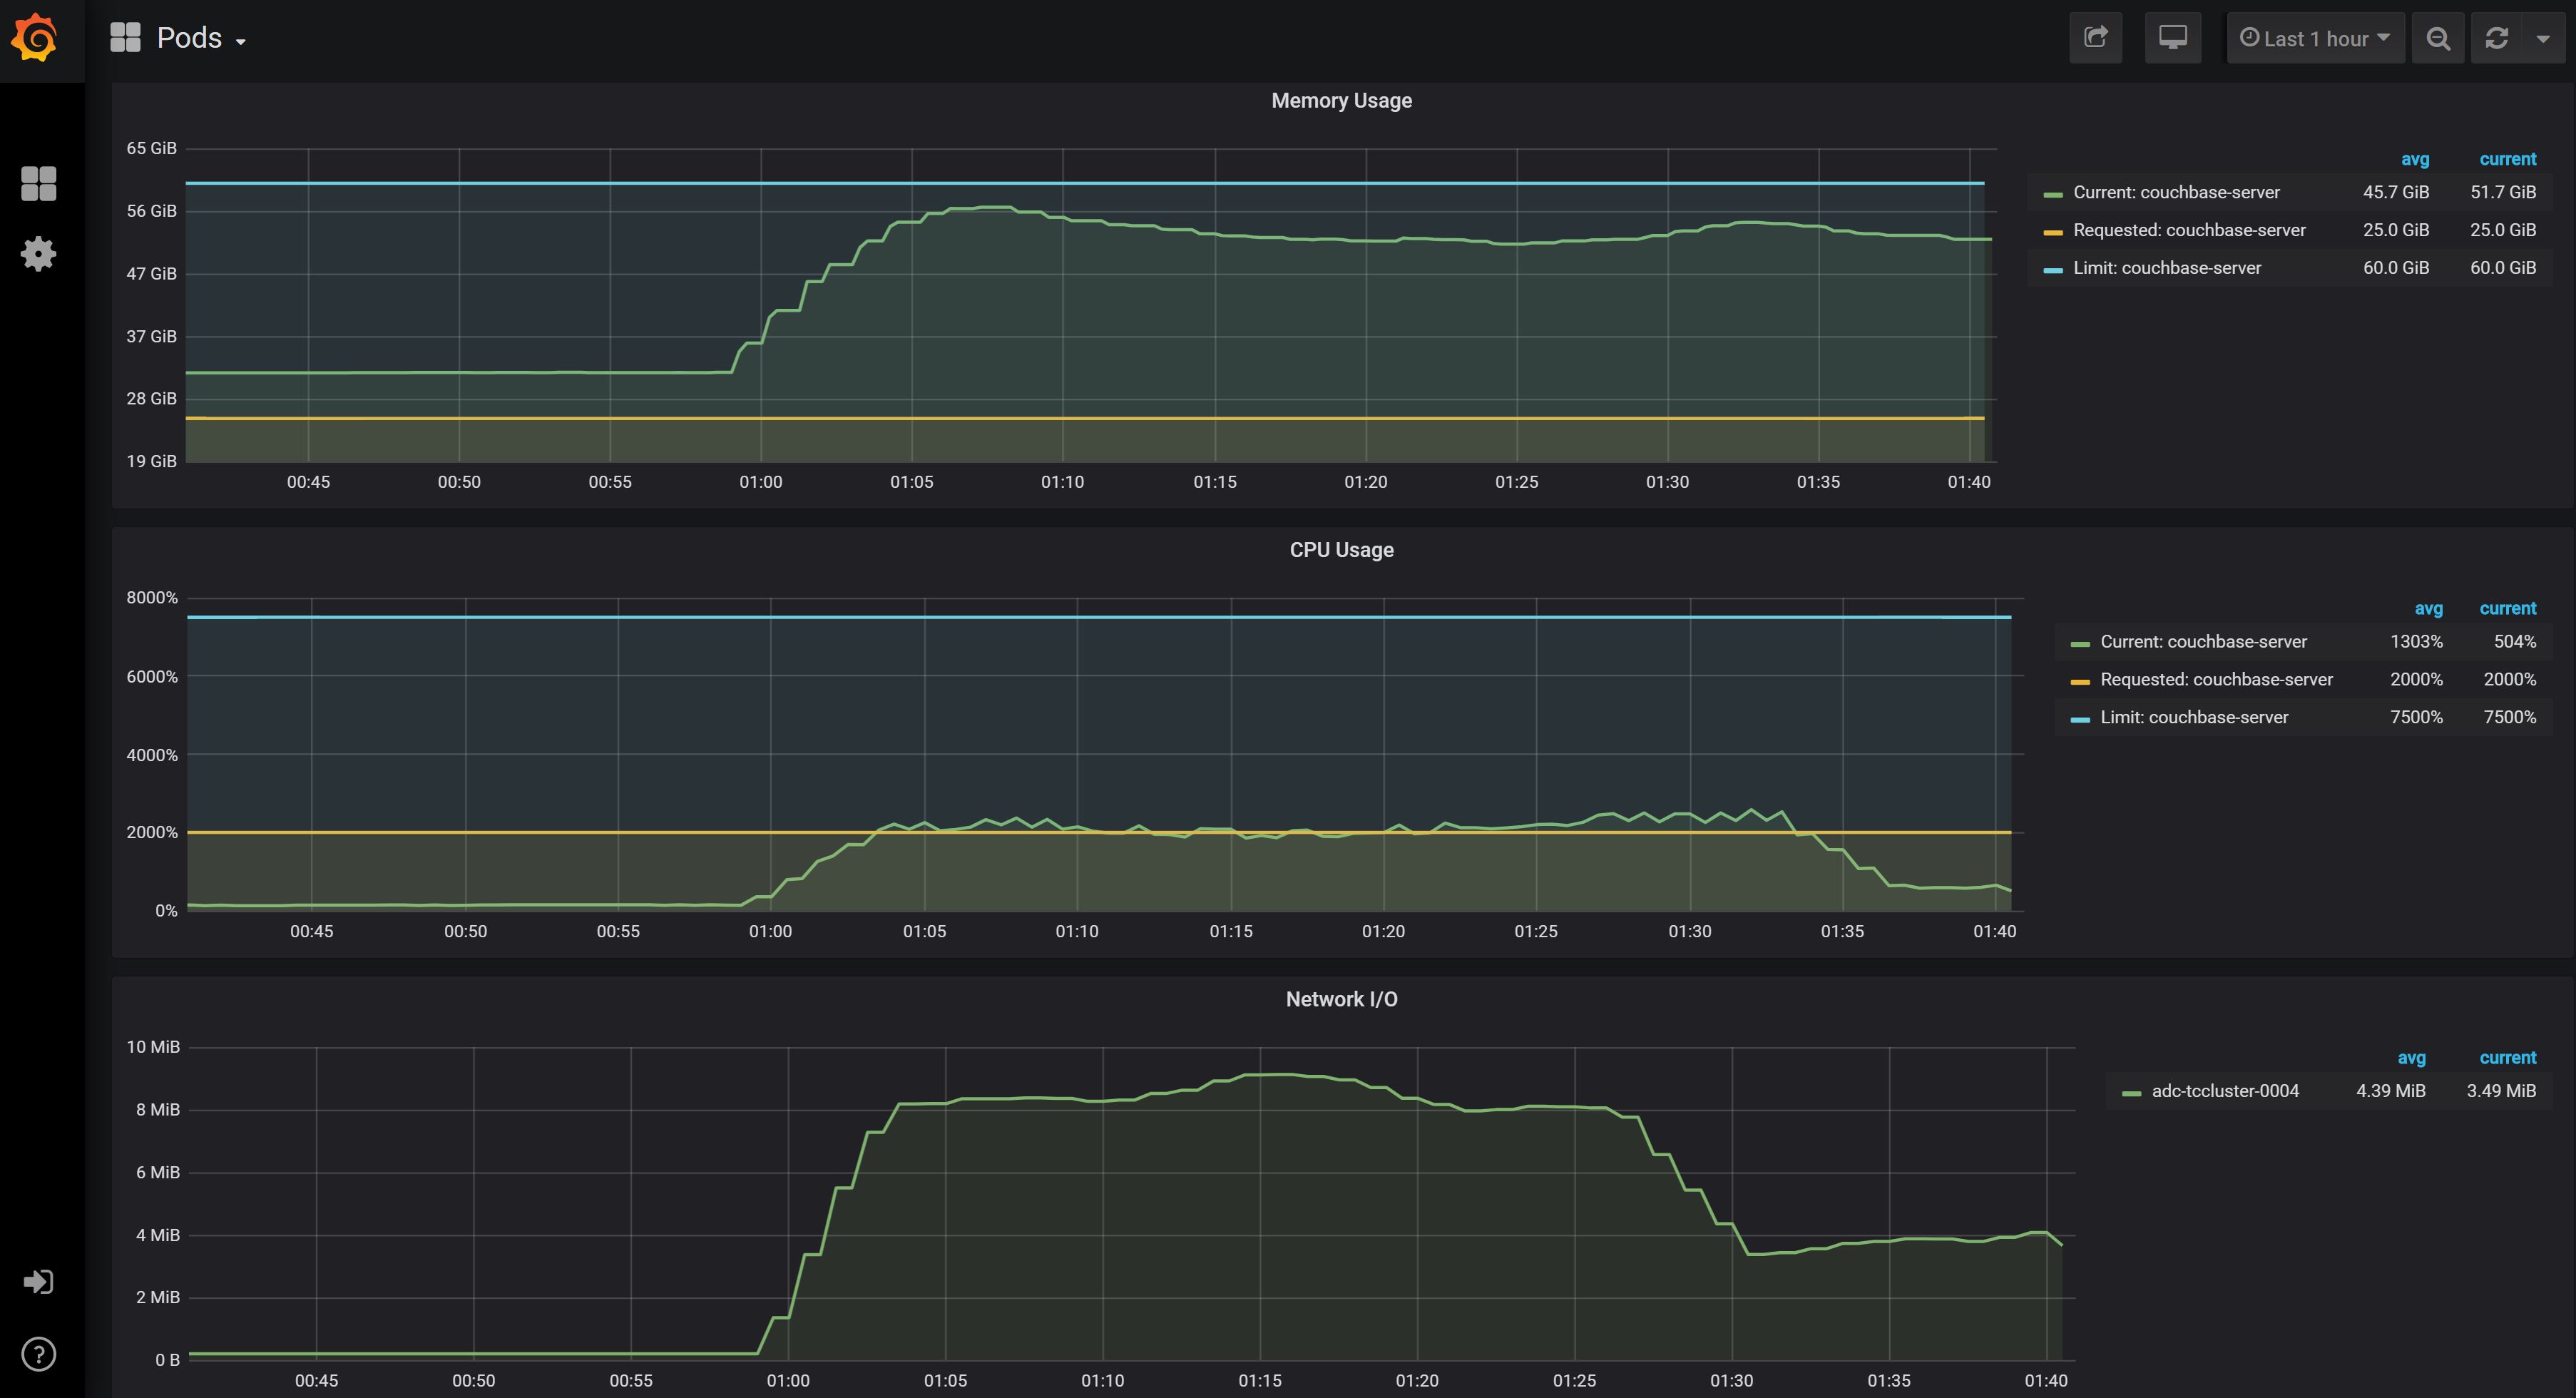
Usage below capture in Prometheus while Index build in progress from 1 AM EST to 1:40 AM EST … took ~40 minutes with 1024 indexerthreads .
Uploading the log now.
I see your stat in IO bandwidth limitation .
We got iperf run across POD’s in 3 node cluster and it was showing 6-7 Gbits/S .(Ip has been masked)
Client on 10.30.xxx.xxx: Connecting to host iperf3-server, port 5201
Client on 10.30.xxx.xxx: [ 4] local 10.42.3.121 port 51562 connected to 10.43.220.216 port 5201
Client on 10.30.xxx.xxx: [ ID] Interval Transfer Bandwidth Retr Cwnd
Client on 10.30.xxx.xxx: [ 4] 0.00-1.00 sec 903 MBytes 7.57 Gbits/sec 1130 1.39 MBytes
Client on 10.30.xxx.xxx: [ 4] 1.00-2.00 sec 825 MBytes 6.91 Gbits/sec 1450 692 KBytes
Client on 10.30.xxx.xxx: [ 4] 2.00-3.00 sec 771 MBytes 6.47 Gbits/sec 920 814 KBytes
Client on 10.30.xxx.xxx: [ 4] 3.00-4.00 sec 856 MBytes 7.18 Gbits/sec 179 1.24 MBytes
Client on 10.30.xxx.xxx: [ 4] 4.00-5.00 sec 928 MBytes 7.77 Gbits/sec 197 778 KBytes
Client on 10.30.xxx.xxx: [ 4] 5.00-6.00 sec 806 MBytes 6.76 Gbits/sec 743 857 KBytes
Client on 10.30.xxx.xxx: [ 4] 6.00-7.00 sec 882 MBytes 7.41 Gbits/sec 110 1.05 MBytes
Client on 10.30.xxx.xxx: [ 4] 7.00-8.00 sec 875 MBytes 7.33 Gbits/sec 230 1.35 MBytes
Client on 10.30.xxx.xxx: [ 4] 8.00-9.00 sec 782 MBytes 6.57 Gbits/sec 705 861 KBytes
Client on 10.30.xxx.xxx: [ 4] 9.00-10.00 sec 854 MBytes 7.17 Gbits/sec 579 625 KBytes
Client on 10.30.xxx.xxx: - - - - - - - - - - - - - - - - - - - - - - - - -
Client on 10.30.xxx.xxx: [ ID] Interval Transfer Bandwidth Retr
Client on 10.30.xxx.xxx: [ 4] 0.00-10.00 sec 8.28 GBytes 7.12 Gbits/sec 6243 sender
Client on 10.30.xxx.xxx: [ 4] 0.00-10.00 sec 8.28 GBytes 7.11 Gbits/sec receiver
Client on 10.30.xxx.xxx:
Client on 10.30.xxx.xxx: iperf Done.
Okay , thats different cluster . regardless performance is same in non-MDS …
Uploaded all logs relevant to MDS now … it should be available for you to see .
IO , network , storage , index creation timing all relevant to non MDS . Sorry for back and forth …
I will restore my MDS cluster back as anyways memory optimized is neither helpful .
do you still want to get log from MDS ?
I need logs from non-MDS setup where you have co-located KV, index services on the same cluster, built index using MOI.
Is there a network configuration that you have to do in your cluster setup to increase network bandwidth between nodes? By default, it looks like it is limited to 10MB/sec from the stats you mentioned. This is too less. From iPerf, I see that up to 6Gbps can be supported. Can you increase the bandwidth to 1Gbps or 10Gbps and then try index builds. You should see some great performance improvement.
Also, the graph from Prometheus is for indexer node (Assuming you did not change the cluster configuration). I am more interested in bandwidth of KV nodes. Can you share the same graphs for KV nodes?
Yes , the one uploaded already is from non-MDS (colocated with KV , Indexes) but this has SGI and not MOI .
nonMDS has MOI and I am recreating the indexes . Once done I will upload cbcollect logs .
Actually in the same host iperf has 40 Gbps transmission but I need to talk to Network folks on why across POD it is restricted to 10 MB / S .
I will take that suggestion and comeback .
the graph in from indexer node (because anyway it is non_MDS)
The network I/O is almost same across all three POD’s in my Prometheus graph .
Ok. I will wait for your feedback from network team. After you have uploaded for non-MDS MOI setup, I will analyse those logs.
Cool .thanks @varun.velamuri .
Just FYI each doc will be around 1.61 KB is size …
Log has been uploaded . The MOI still was running .
note wherever you see tccbldc its MDS and tccbadc its non-MDS logs
tccbldc-cluster-0014.tccbldc-cluster.bi-cb.svc.zip
@eldorado, For the non-MDS cluster, I see that the cluster has 3 KV+nq1l+index nodes. Each indexer has to still stream data from 2 other nodes which results in more data being transferred and therefore index build slow-down. I have mis-understood the experiment you are doing.
Between MDS and non-MDS cluster setup, you will see a perf improvement in your case if your are building a non-partitioned index. Because, in MDS setup, indexer node will stream data from one KV process on the same node and over network for the other two KV processes. For a partitioned index, it is difficult to say if there is any performance improvement because the data for partition on which the index is being built may reside on a different node.
Also, as we found earlier that network is a bottleneck, having MOI or Standard global secondary storage will make little difference in this case as indexer is not the bottleneck. Also, in your case, the index is 100% resident in memory, the storage mode also makes little difference. From our perf cluster experiments, index build takes almost the same time for MOI or standard global secondary storage. I think we should first fix the network bottleneck before benchmarking further index build times.
Did you get any chance to improve the network bandwidth?
@varun.velamuri _ Hi Varun , we are currently holding on our decisions on couchbase for several reason . As soon as those clear I will re circle back .
thanks